
Bitcoin (BTC) continues to exhibit a strong technical setup after holding a weekly close above $63,000 for three consecutive weeks since tagging a new 2026 low near $59,000. This pattern closely resembles a bottom-building phase seen in previous trend reversals in bearish periods.
At the same time, Bitcoin futures open interest has fallen 19.5% from its June peak, funding rates have cooled to 0.02% from 0.1%, and spot Bitcoin exchange-traded fund (ETF) outflows have slowed sharply to $540 million over the past two weeks from $5.5 billion the prior month.
Together, the data points to a market that is shedding excess selling pressure while holding near a key support zone for BTC.
Bitcoin’s weekly chart echoes prior market bottoms
Bitcoin’s recent weekly price action resembles a pattern seen several times since 2023. Once a local bottom is established, the price often trades close to that range for weeks before a sustained uptrend develops. One exception came in November 2025, when the price spent roughly 10 weeks moving sideways above $88,000 before breaking lower to the $60,000 level.
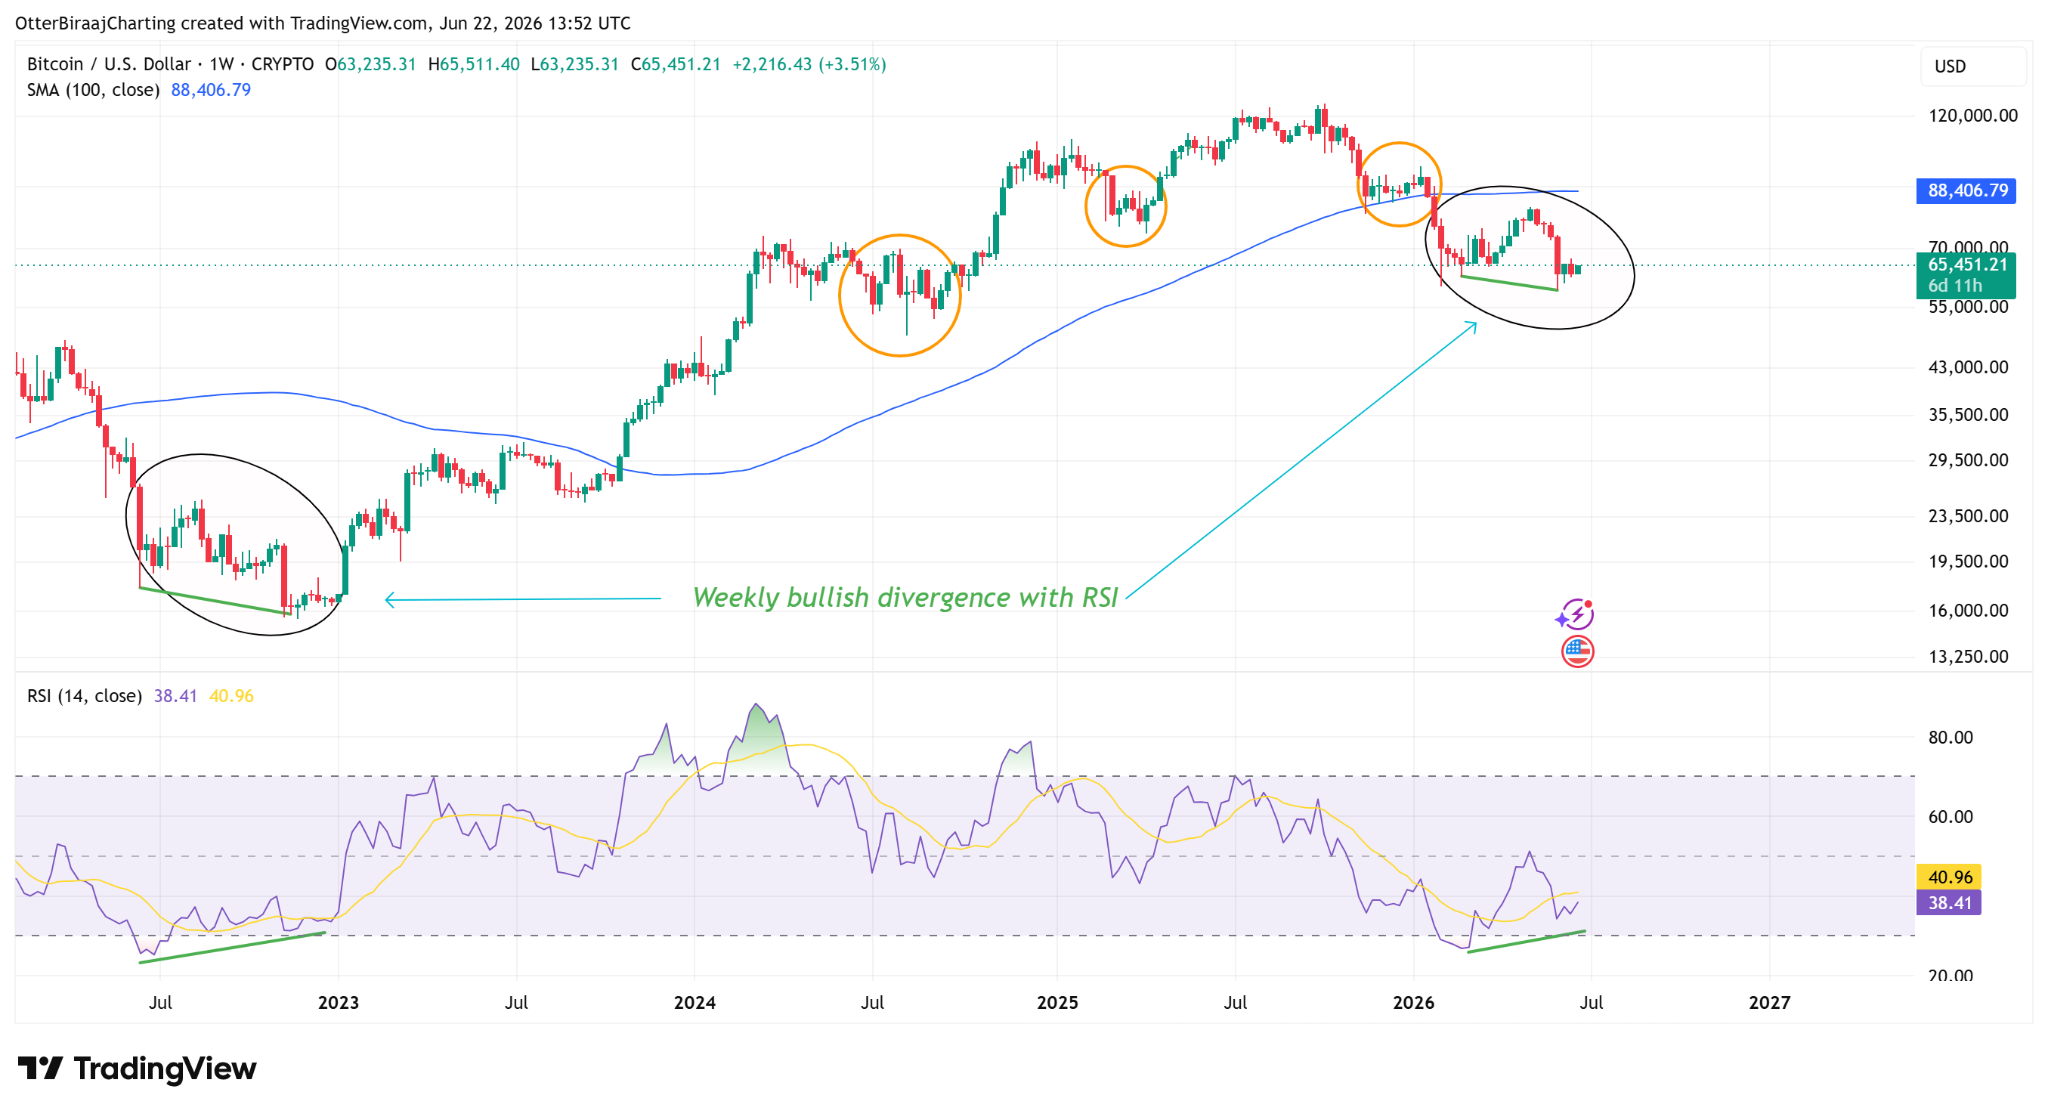
BTC/USD, one-week chart. Source: Cointelegraph/TradingView
The current setup also resembles the price from late 2022 and early 2023. During that period, the weekly relative strength index (RSI) entered oversold territory, recovered, and later formed a higher low, while the BTC price printed a lower low, creating a bullish divergence. That bullish divergence marked a key turning point, preceding the broader uptrend that developed during 2023.
The focus is now on the $63,000 area, where the price has formed a positive RSI divergence. The repeated weekly closes above $63,000, keeps Bitcoin trading above its recent low at $59,000 rather than extending towards it. The behavior fits a range-building phase that has appeared near previous turning points, as identified in the chart.
Related: US dollar strength hits highest since May 2025: Five things to know in Bitcoin this week
BTC futures turn less crowded as ETF sell-pressure eases
Bitcoin derivatives markets have become notably less crowded over the past three weeks. Bitcoin funding rates cooled to 0.02% from 0.1% at the start of June, reducing signs of aggressive long positioning.
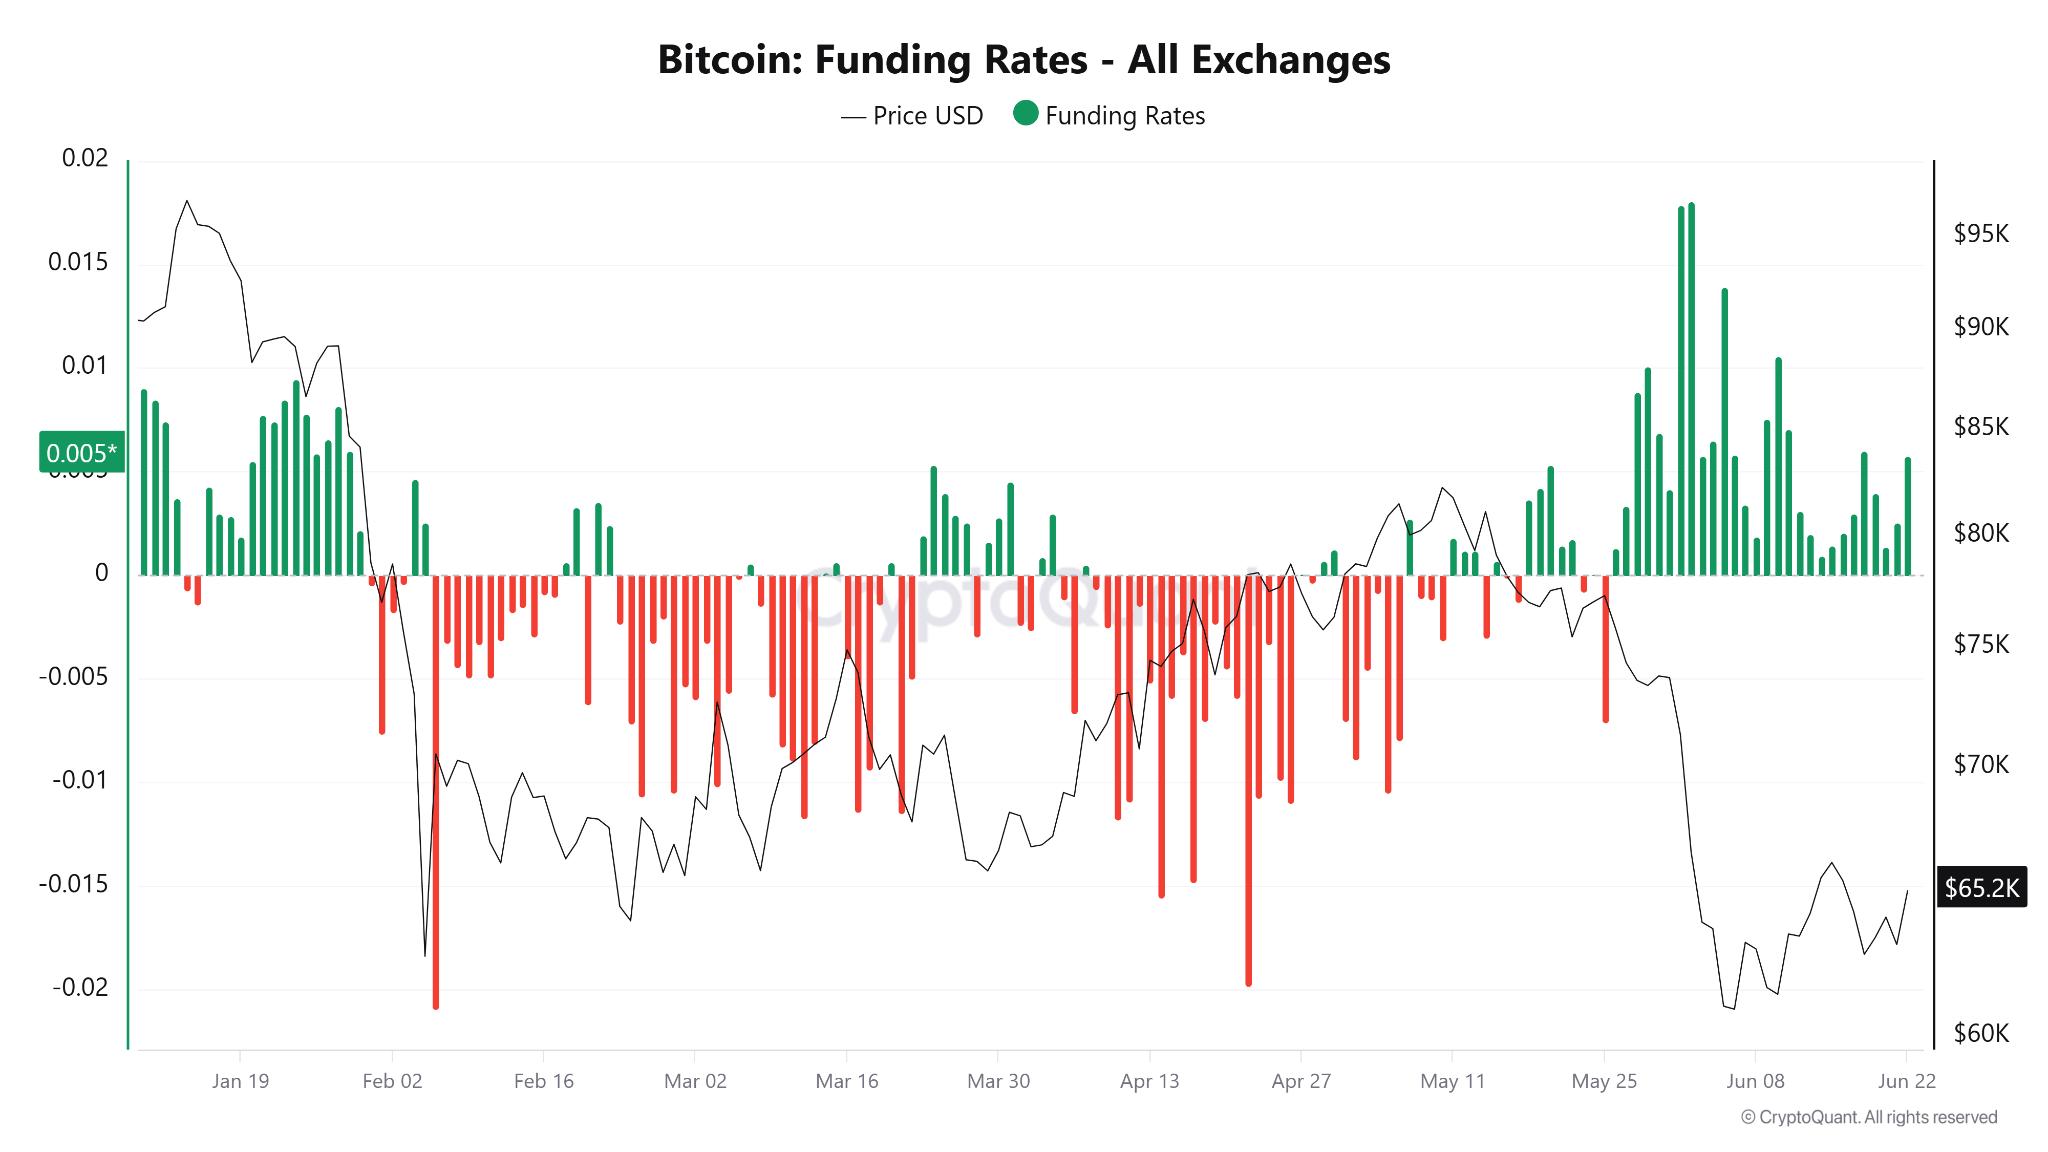
Bitcoin funding rate on all exchanges. Source: CryptoQuant
Crypto analyst Woominkyuu noted that total Bitcoin open interest across exchanges peaked at $25.96 billion on June 1, then fell to $20.89 billion by June 21. The 19.5% decline exceeded Bitcoin’s 11.4% price drop during the same period.
The simultaneous decline in the price and open interest typically signals that existing positions are being closed or liquidated rather than new leveraged bets entering the market. This indicates a significant reduction in excess leverage. It also points to limited evidence of aggressive new short positioning at current levels.
Spot Bitcoin ETF flows show a similar shift with $5.5 billion leaving the spot ETFs between May 15 and June 11. The outflows over the past two weeks total about $540 million, marking a sharp slowdown in selling activity.
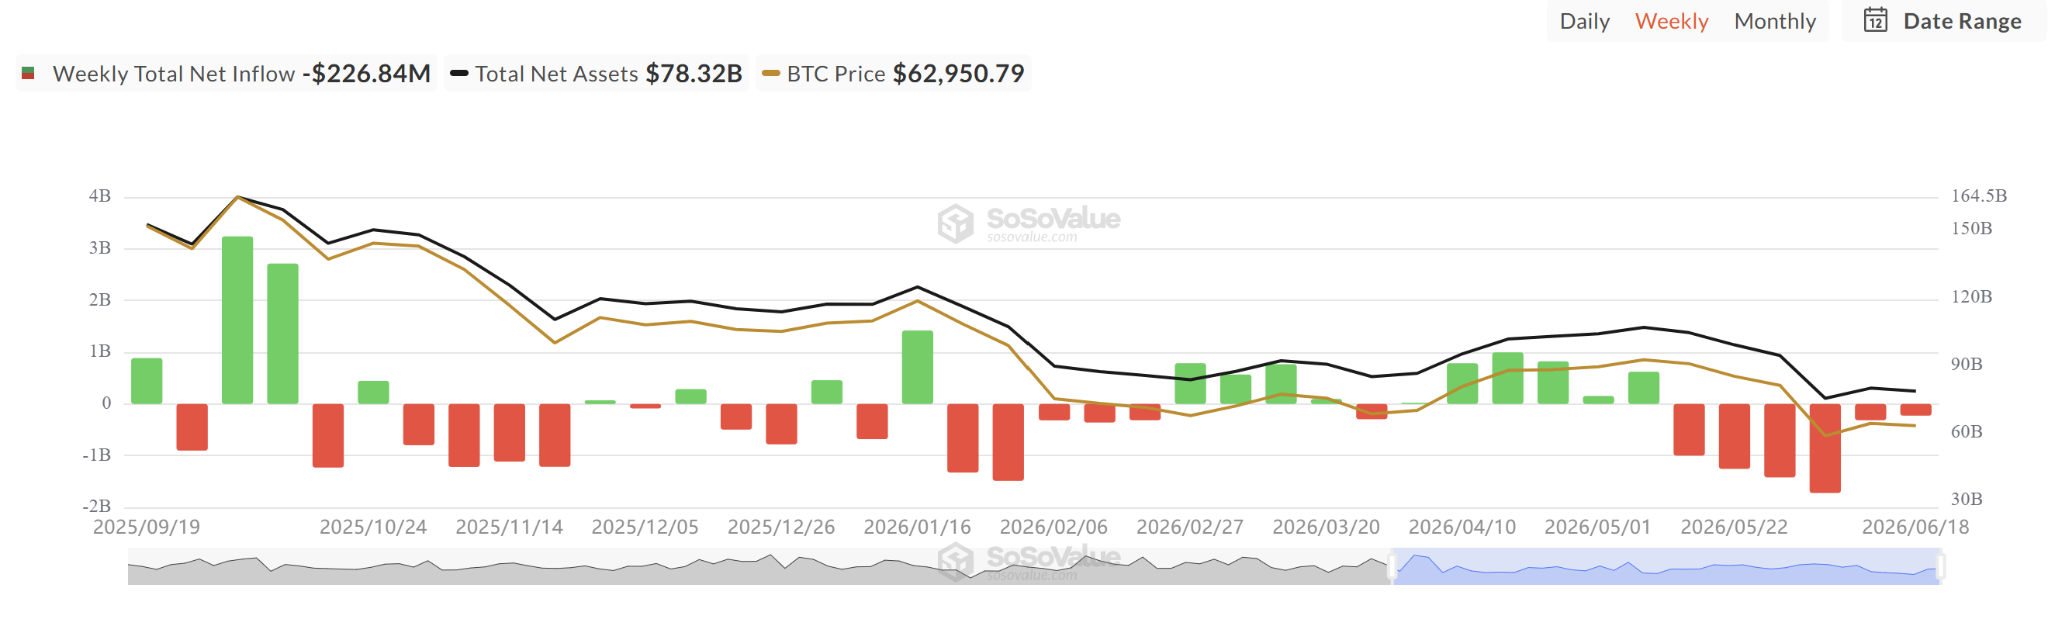
Weekly spot BTC ETF netflows. Source: SoSoValue
Onchain data paints a mixed but constructive picture. Bitcoin researcher Axel Adler Jr. highlighted that long-term holders’ realized supply recently reached 12.42 million BTC, a level associated with supply maturation and coins moving into stronger hands.
At the same time, Bitcoin’s sales pressure metric has stayed inactive for 1,256 consecutive days, the longest stretch on record. The data points to continued supply maturation alongside other signs that Bitcoin may be stabilizing near a potential cycle low.
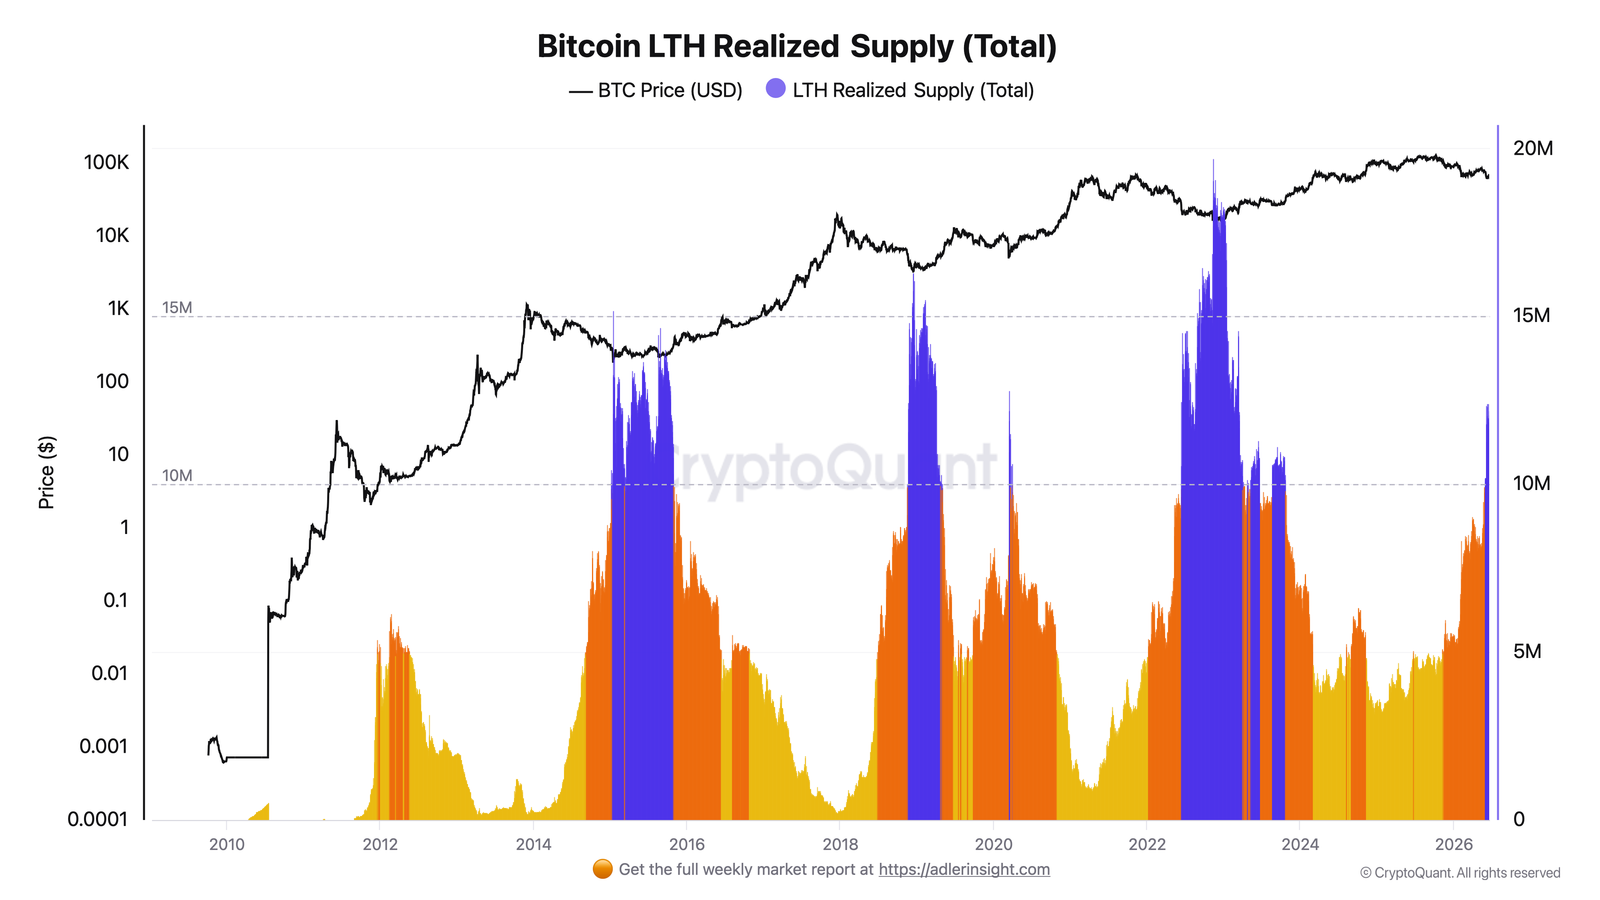
Bitcoin LTH realized supply. Source: Axel Adler Jr.
Related: Strategy adds $300M to USD Reserve, acquires 520 BTC