
ETH sold off at the weekly open, but its net taker volume metric turned positive for the first time in years. Will bulls take notice of the signal and attempt to press Ether price higher?
Ether (ETH) derivatives data has begun to highlight a structural shift. After nearly three years of sell-side dominance, ETH’s net taker volume has turned positive, possibly pointing to renewed interest from futures traders.
Key takeaways:
-
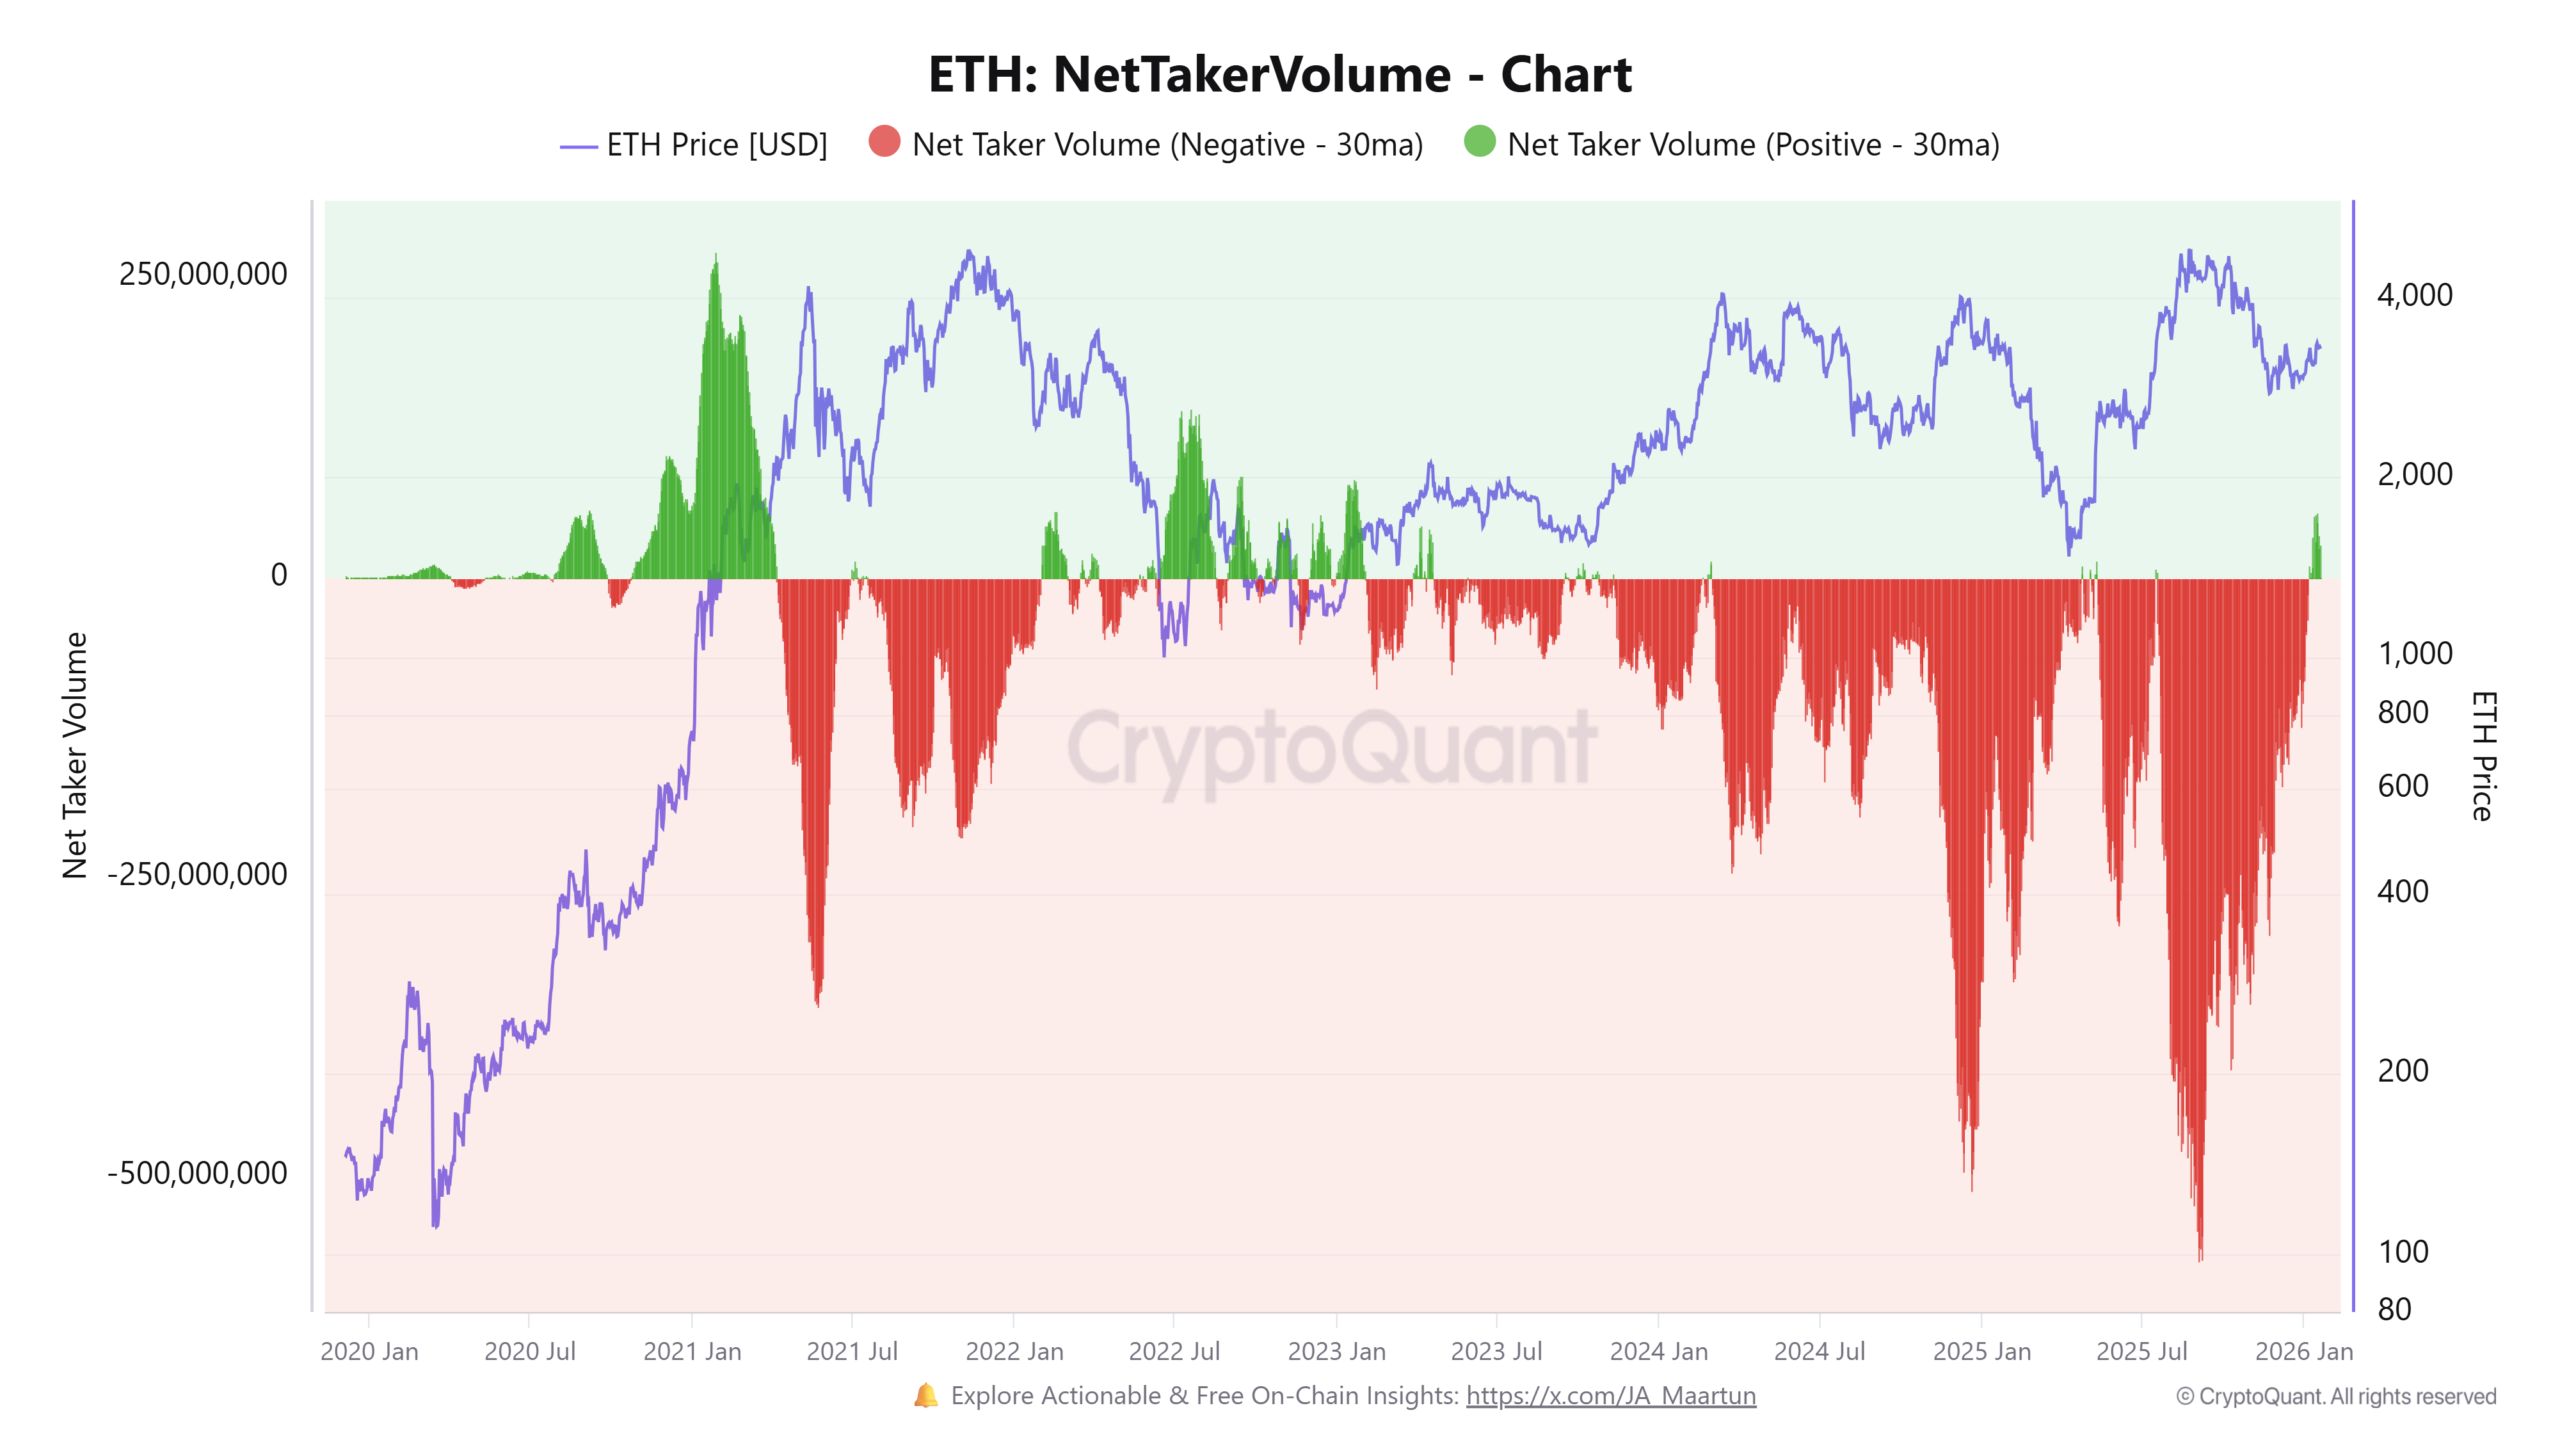
ETH Net Taker volume reached $390 million since Jan. 6, the largest buy imbalance since January 2023.
-
Since 2023, positive taker volume has aligned with range bottoms and the continuation of uptrends.
-
ETH holds above the $3,000 support level despite a negative CVD, indicating absorption by larger players.
ETH Net Taker volume highlights a rare trend shift
Ethereum’s Net Taker Volume has registered roughly $390 million in positive imbalance since Jan. 6, marking its strongest buy-side dominance since January 2023. The metric tracks whether traders are aggressively buying at market prices or selling into bids. A positive reading indicates conviction among traders over the long term.

Historically, strong positive flips in Net Taker Volume since 2020 have aligned with bottoming ranges or early-stage uptrends, rather than local tops. Sustained positivity typically reflects leveraged participants’ positioning for continuation, often before the broader trend becomes visible.
This shift follows years of persistent sell-side pressure, suggesting a change in futures demand rather than a short-lived squeeze. In past cycles, similar transitions preceded multi-week trend expansions.
Related: Ethereum activity surge could be linked to dusting attacks: Researcher
ETH chases underlying liquidity
Data from CryptoQuant noted that while ETH traded near $3,000, cumulative volume delta (CVD) remains negative at -3,676 ETH on Jan. 19, showing short-term selling pressure. Despite this, the 30-day correlation between price and CVD stands near 0.62, indicating price action is still partially supported by the available liquidity.
This divergence points to a corrective phase, and short-term traders appear to be taking profits. Data shows larger participants gradually repositioning, keeping ETH stable above $3,000.

From a technical standpoint, ETH has reverted to its five-month point of control between $3,050 and $3,140, in line with last week’s Cointelegraph forecast. The broader uptrend remains intact as long as daily closes hold above $3,000. A break below that level would signal a bearish shift in structure.
Hyblock data also shows roughly $540 million in net long positions near $3,100, with another $500 million liquidity cluster below $3,000. This positioning suggests ETH price may continue to fluctuate within this range as the liquidity rebalances.

Related: Ethereum L2 MegaETH peaks at 47K TPS ahead of ‘global stress test’
This article does not contain investment advice or recommendations. Every investment and trading move involves risk, and readers should conduct their own research when making a decision. While we strive to provide accurate and timely information, Cointelegraph does not guarantee the accuracy, completeness, or reliability of any information in this article. This article may contain forward-looking statements that are subject to risks and uncertainties. Cointelegraph will not be liable for any loss or damage arising from your reliance on this information.