
- The crypto market trended lower last week as US tariffs rocked the market, causing investors to flee to safe-haven assets like Gold
- Crypto prices, which recovered slightly on Monday and Tuesday, continued trending downward as uncertainty looms
- Meanwhile, spot ETF inflows remained positive despite some days of outflows
Bitcoin
Bitcoin’s price trended lower over the last week following US President Donald Trump’s announcement of tariffs on Canada, Mexico, and China. Investors fled to safe-haven assets like gold while risky assets, like crypto, trended lower.
However, the tariffs are a catalyst for faster price declines as price action shows that Bitcoin was already on a decline in its substructure after failing to swing higher than the $108,000 level three weeks ago.
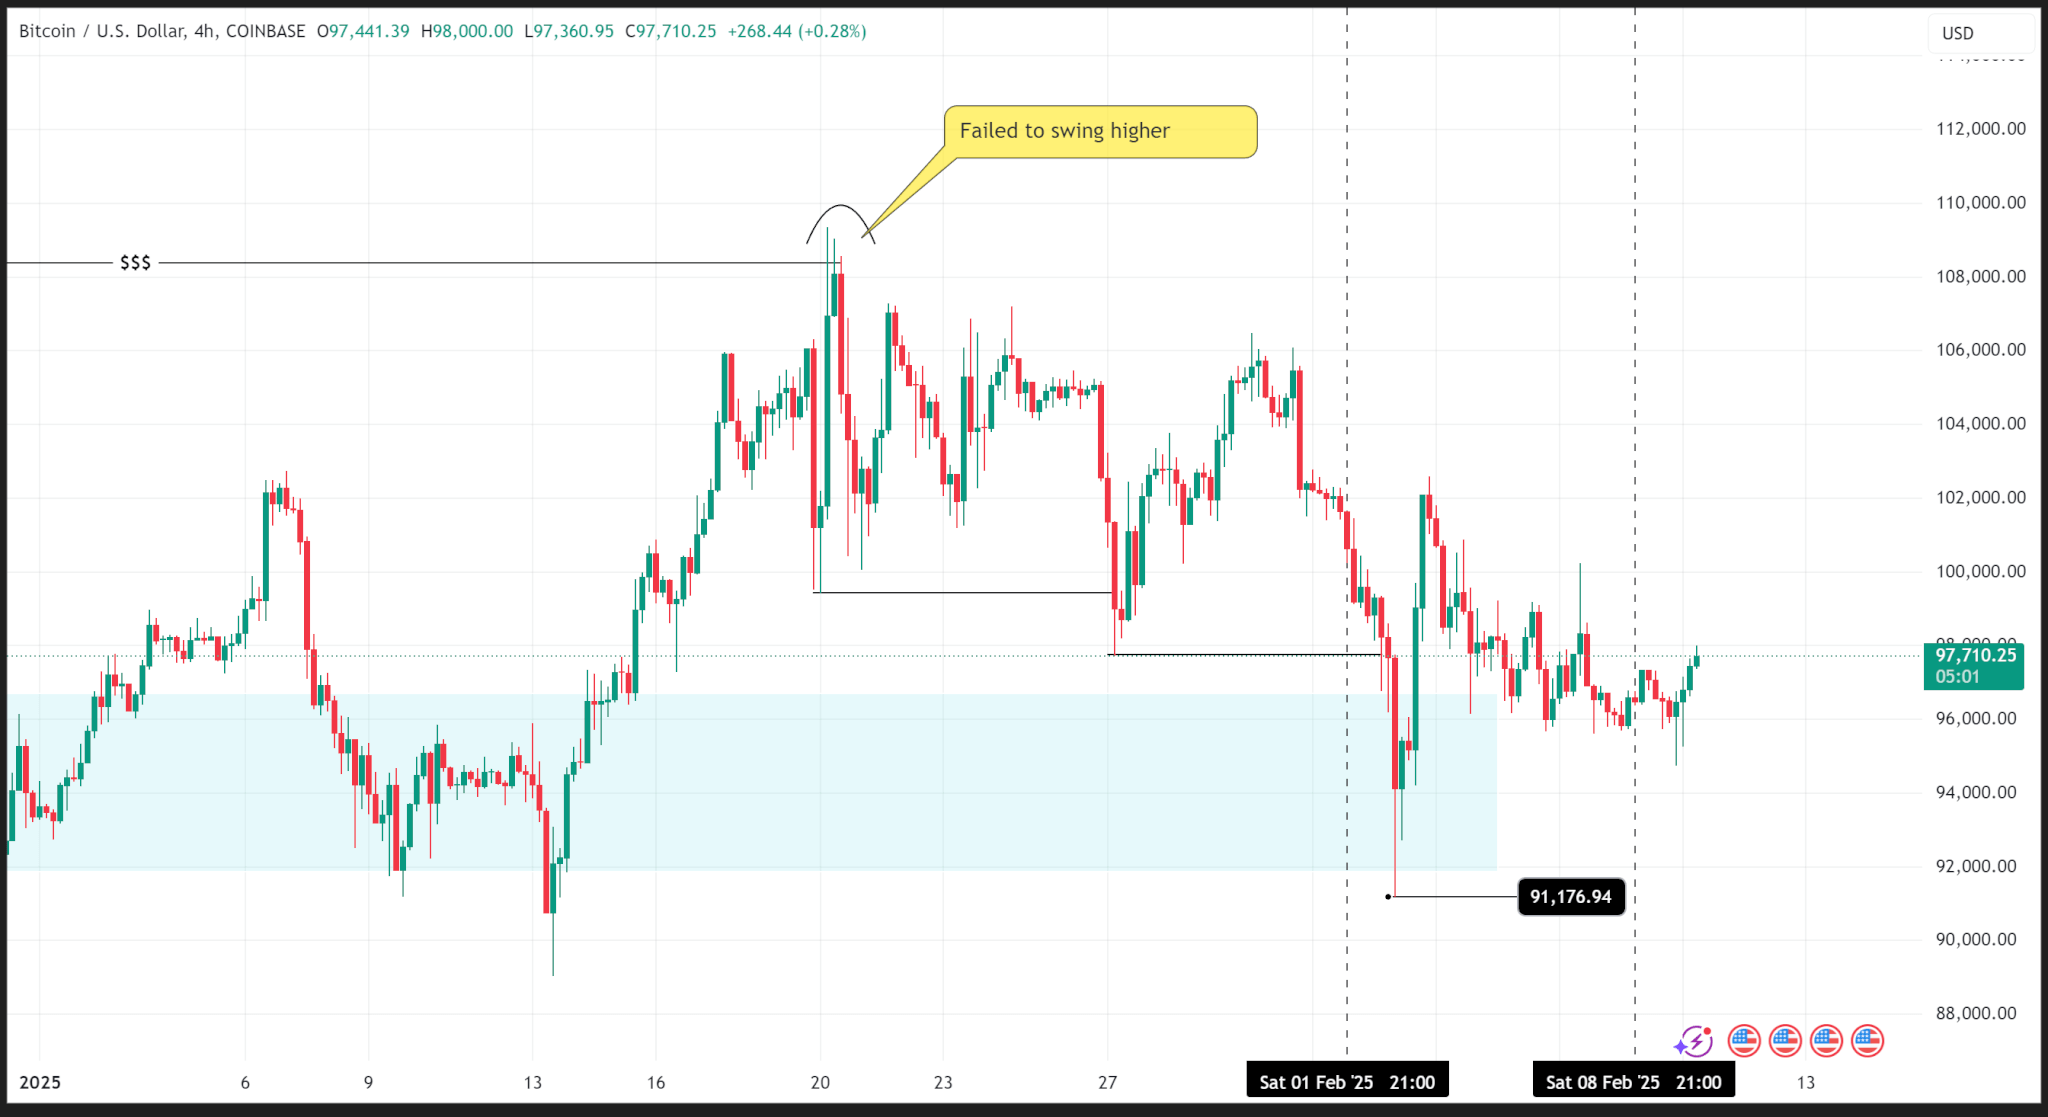
BTC made two consecutive lower lows on the substructure over the last two weeks and traded into the daily demand zone early last week, logging a weekly low of $91,176.94.
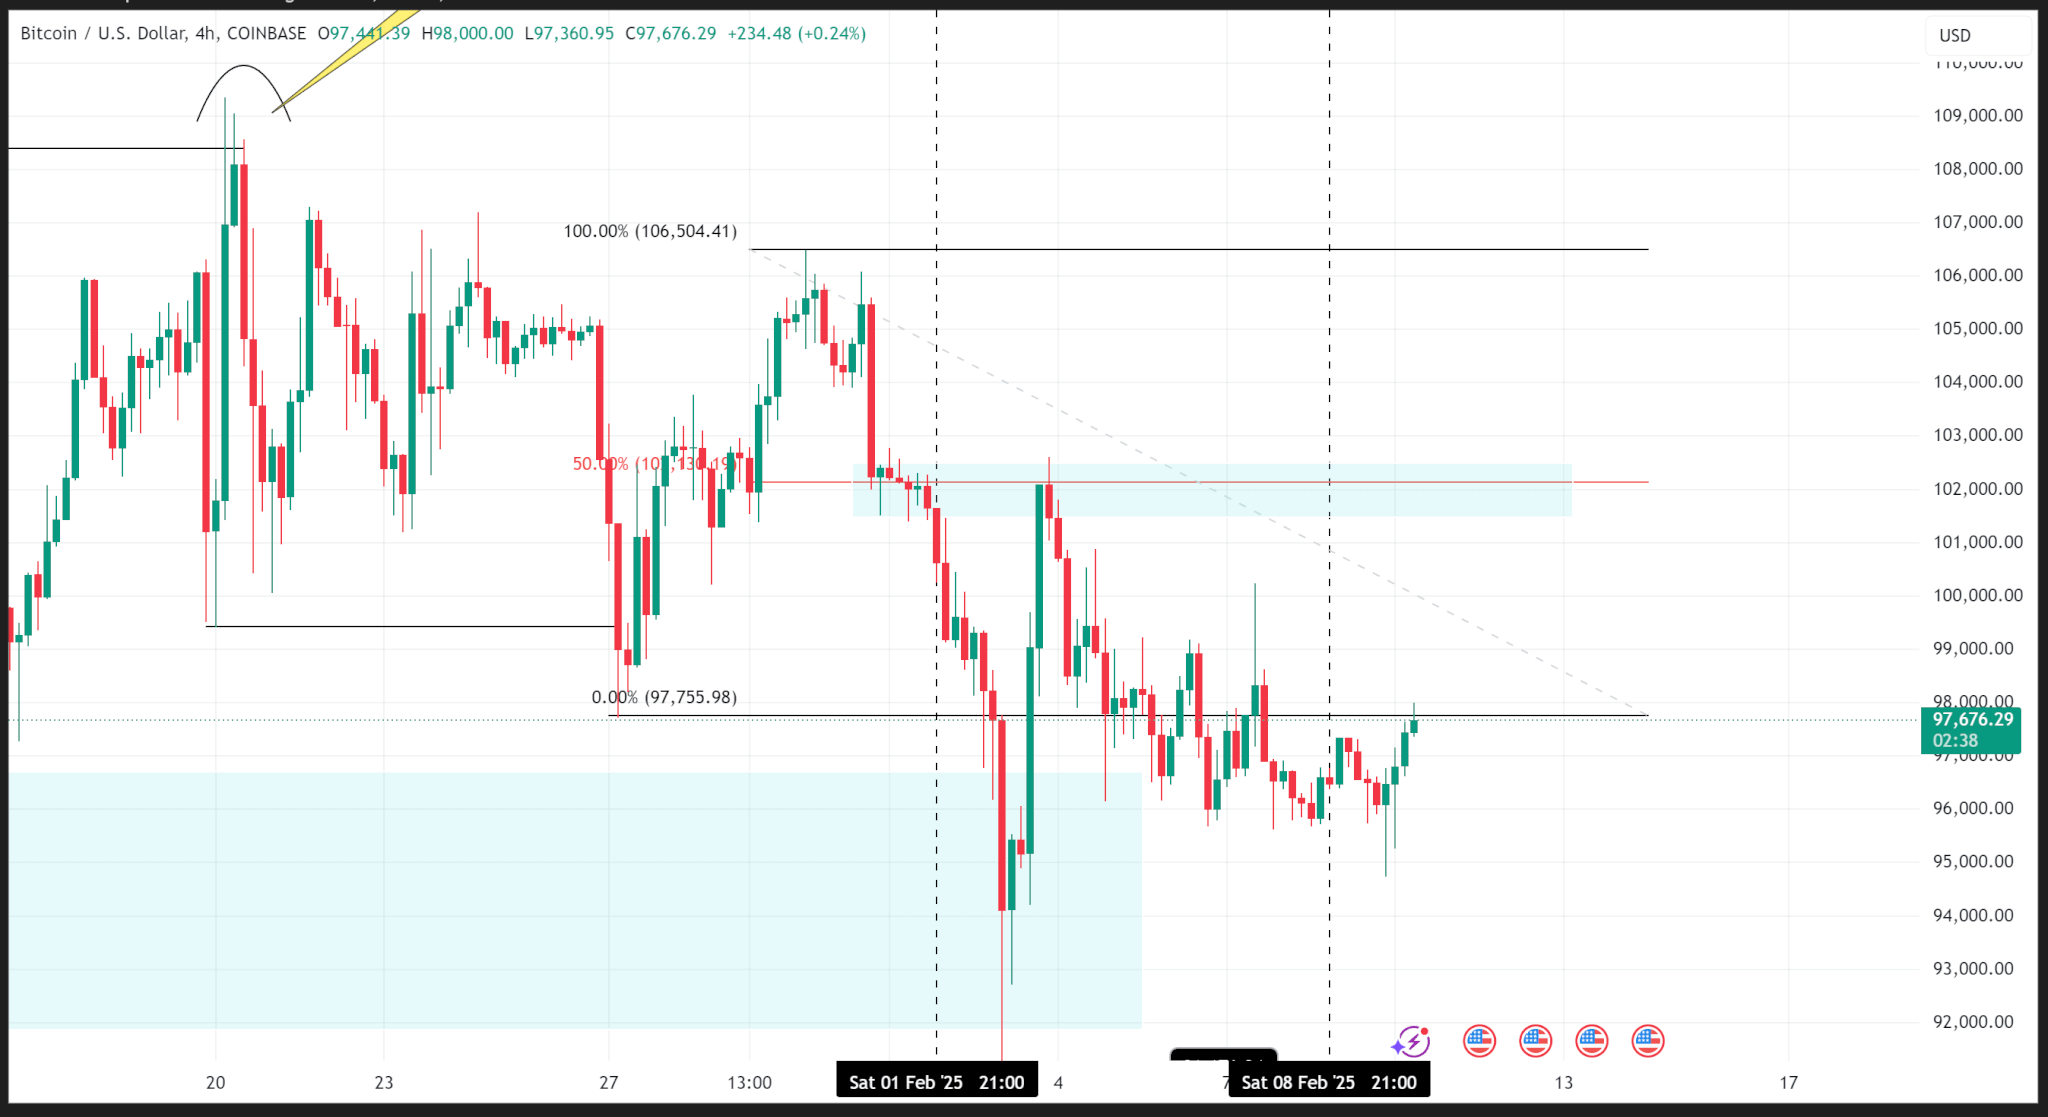
After buying from the demand zone, the price rose to an internal supply zone at $102,000, validated by the 50% Fibonacci level, and sold off that zone to end the week at $96,475.03.
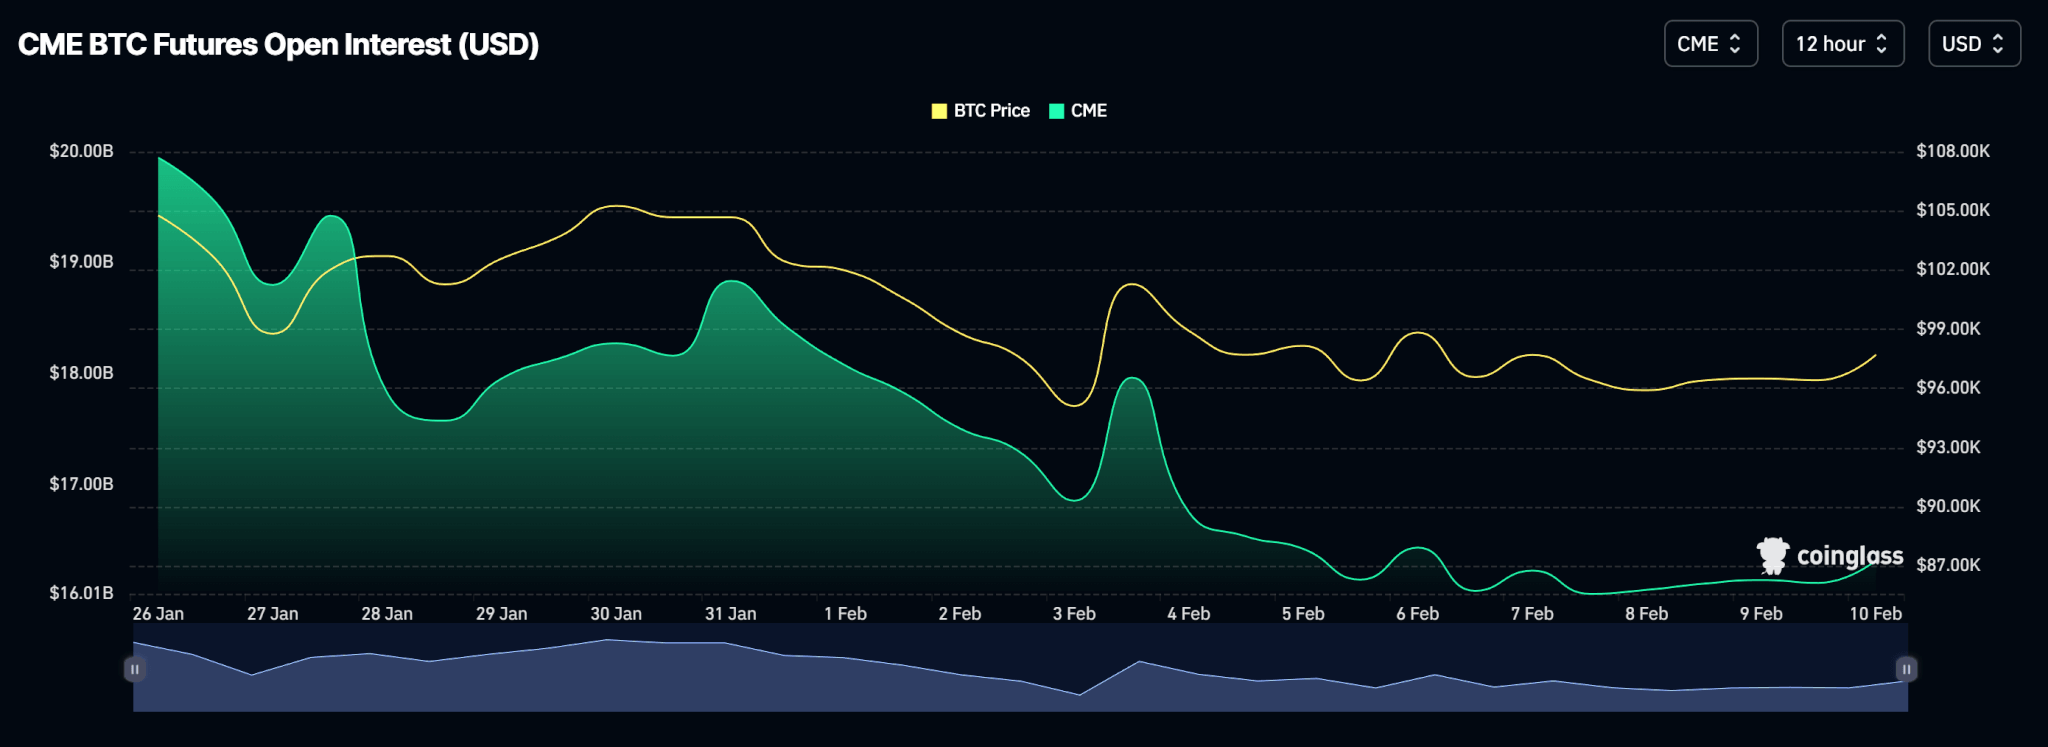
On the CME, where Bitcoin Futures are traded the most, open interest fell last week as traders closed contracts due to uncertainty caused by Trump’s tariffs.
Meanwhile, spot BTC ETFs logged a positive week as net flows printed $208.30 million despite two days of major outflows.
Price Outlook
Provided the price remains above the demand zone on the daily timeframe, then Bitcoin’s overall structure should remain bullish despite price declines on the substructure.
However, a daily close below the demand zone, i.e., below the $90,000 level, may trigger a sell-off to support levels around $84,000 or lower.
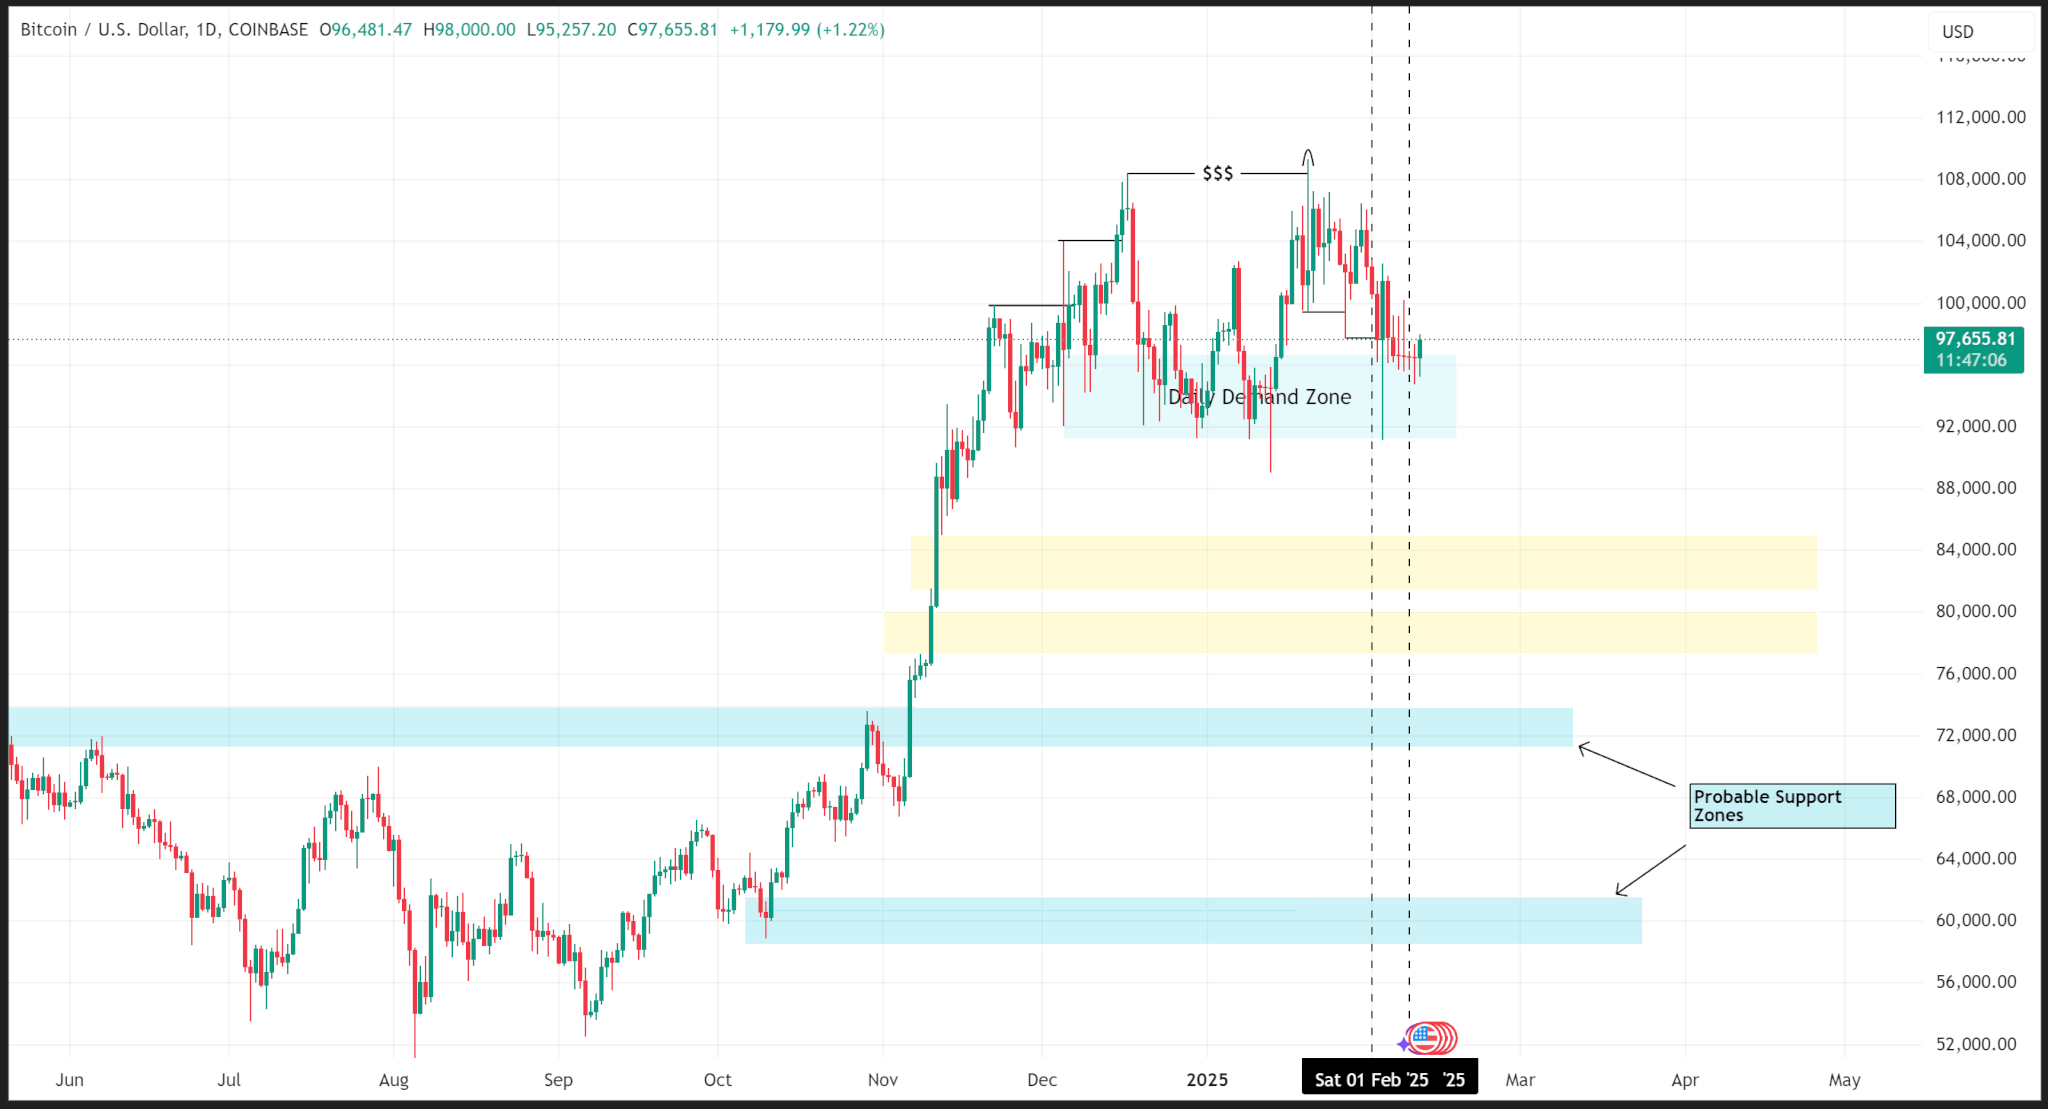
BTC trades at $97,624.73 as of publishing.
Ethereum
After failing to break above March 2024 highs, Ethereum’s price has been on a downtrend on its substructure since mid-December 2024.
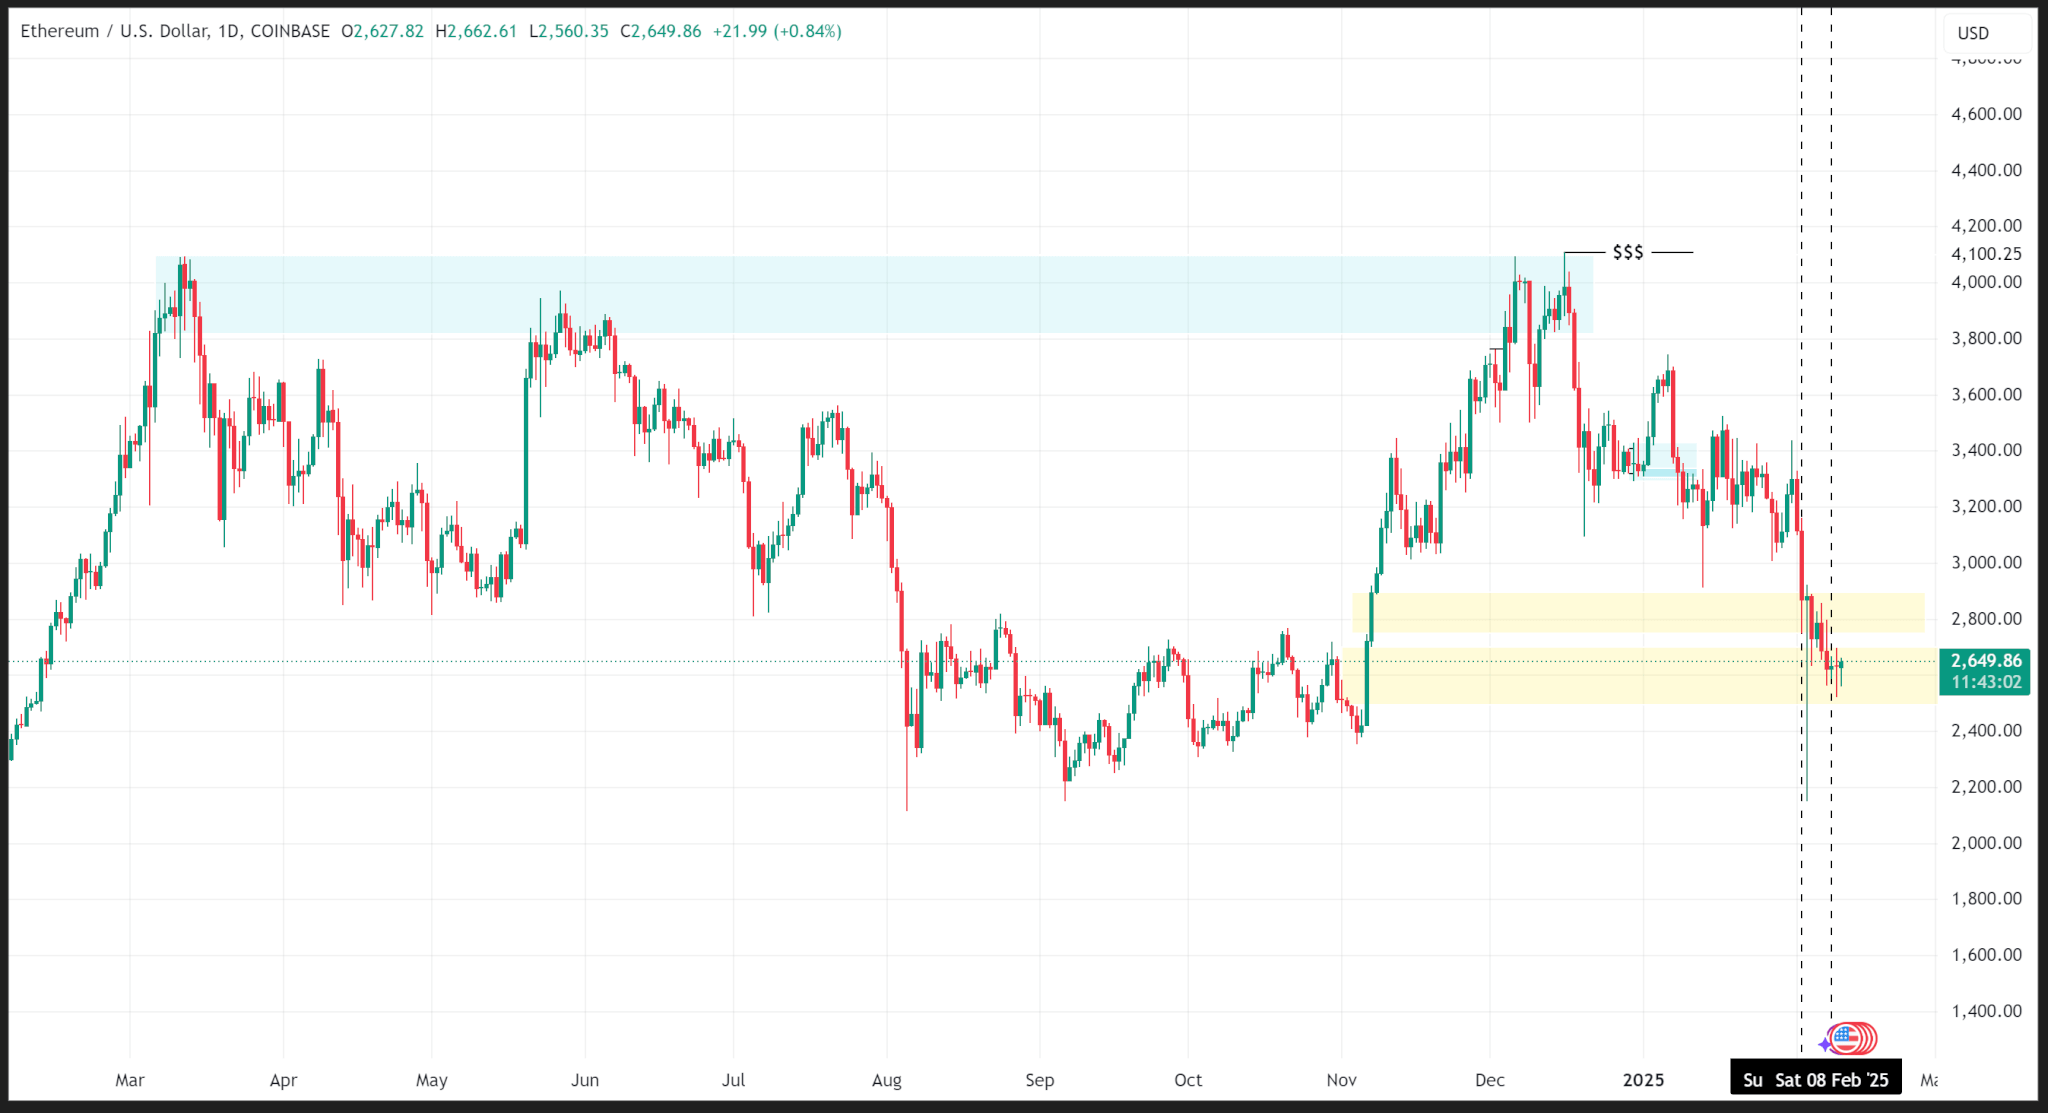
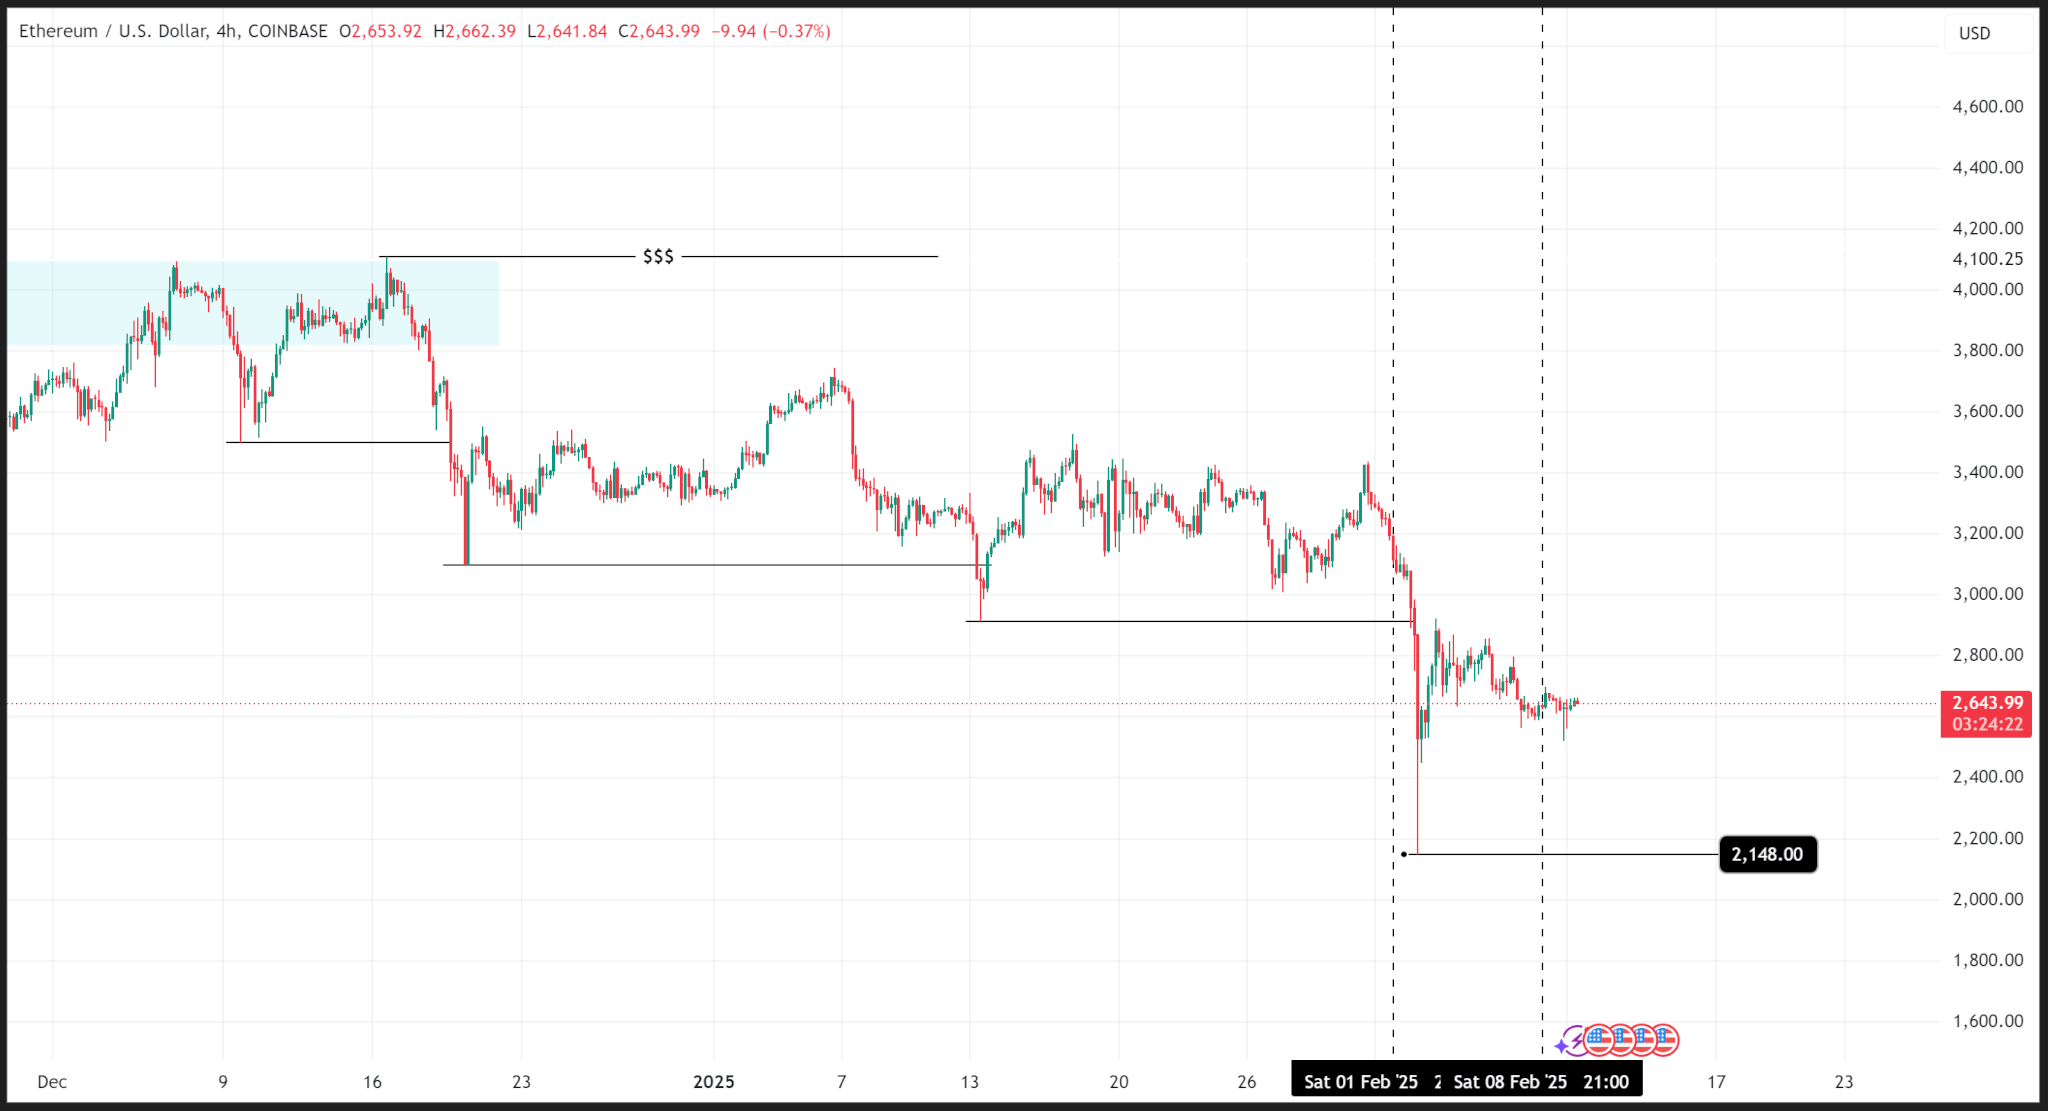
On the 4-hour timeframe, the price logged consecutive lower lows with the most recent low of $2,148.00 reached early last week. The price has improved since then, closing last week at $2,632.16.
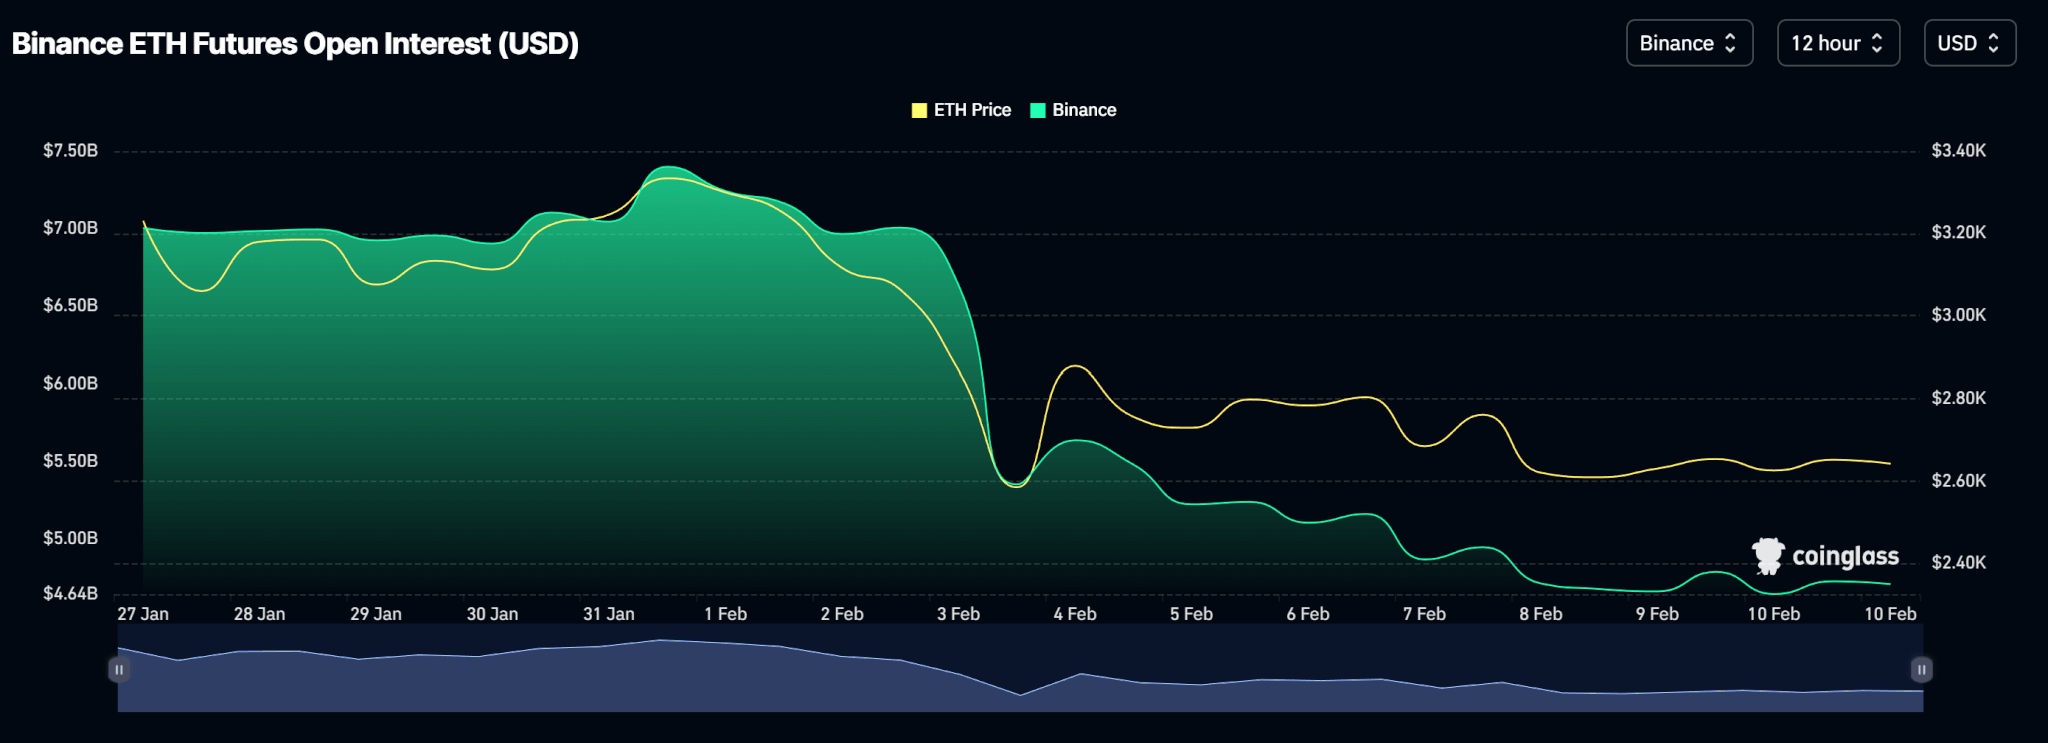
Open interest on Binance, where Ethereum Futures are traded the most, shows a decline in the number of open contracts, which could be another catalyst for price declines.
Meanwhile, spot ETH ETFs logged positive inflows last week, aside from Friday when it logged no inflows (or outflows), totalling $420.20 million for the week.
Price Outlook
The next probable zone for ETH’s price to fall is a major support zone around $2,200. With Trump planning to impose a 25% tariff on steel and aluminium as well as a fresh round of retaliatory tariffs against trade partners, more uncertainty could push ETH’s price there soon.
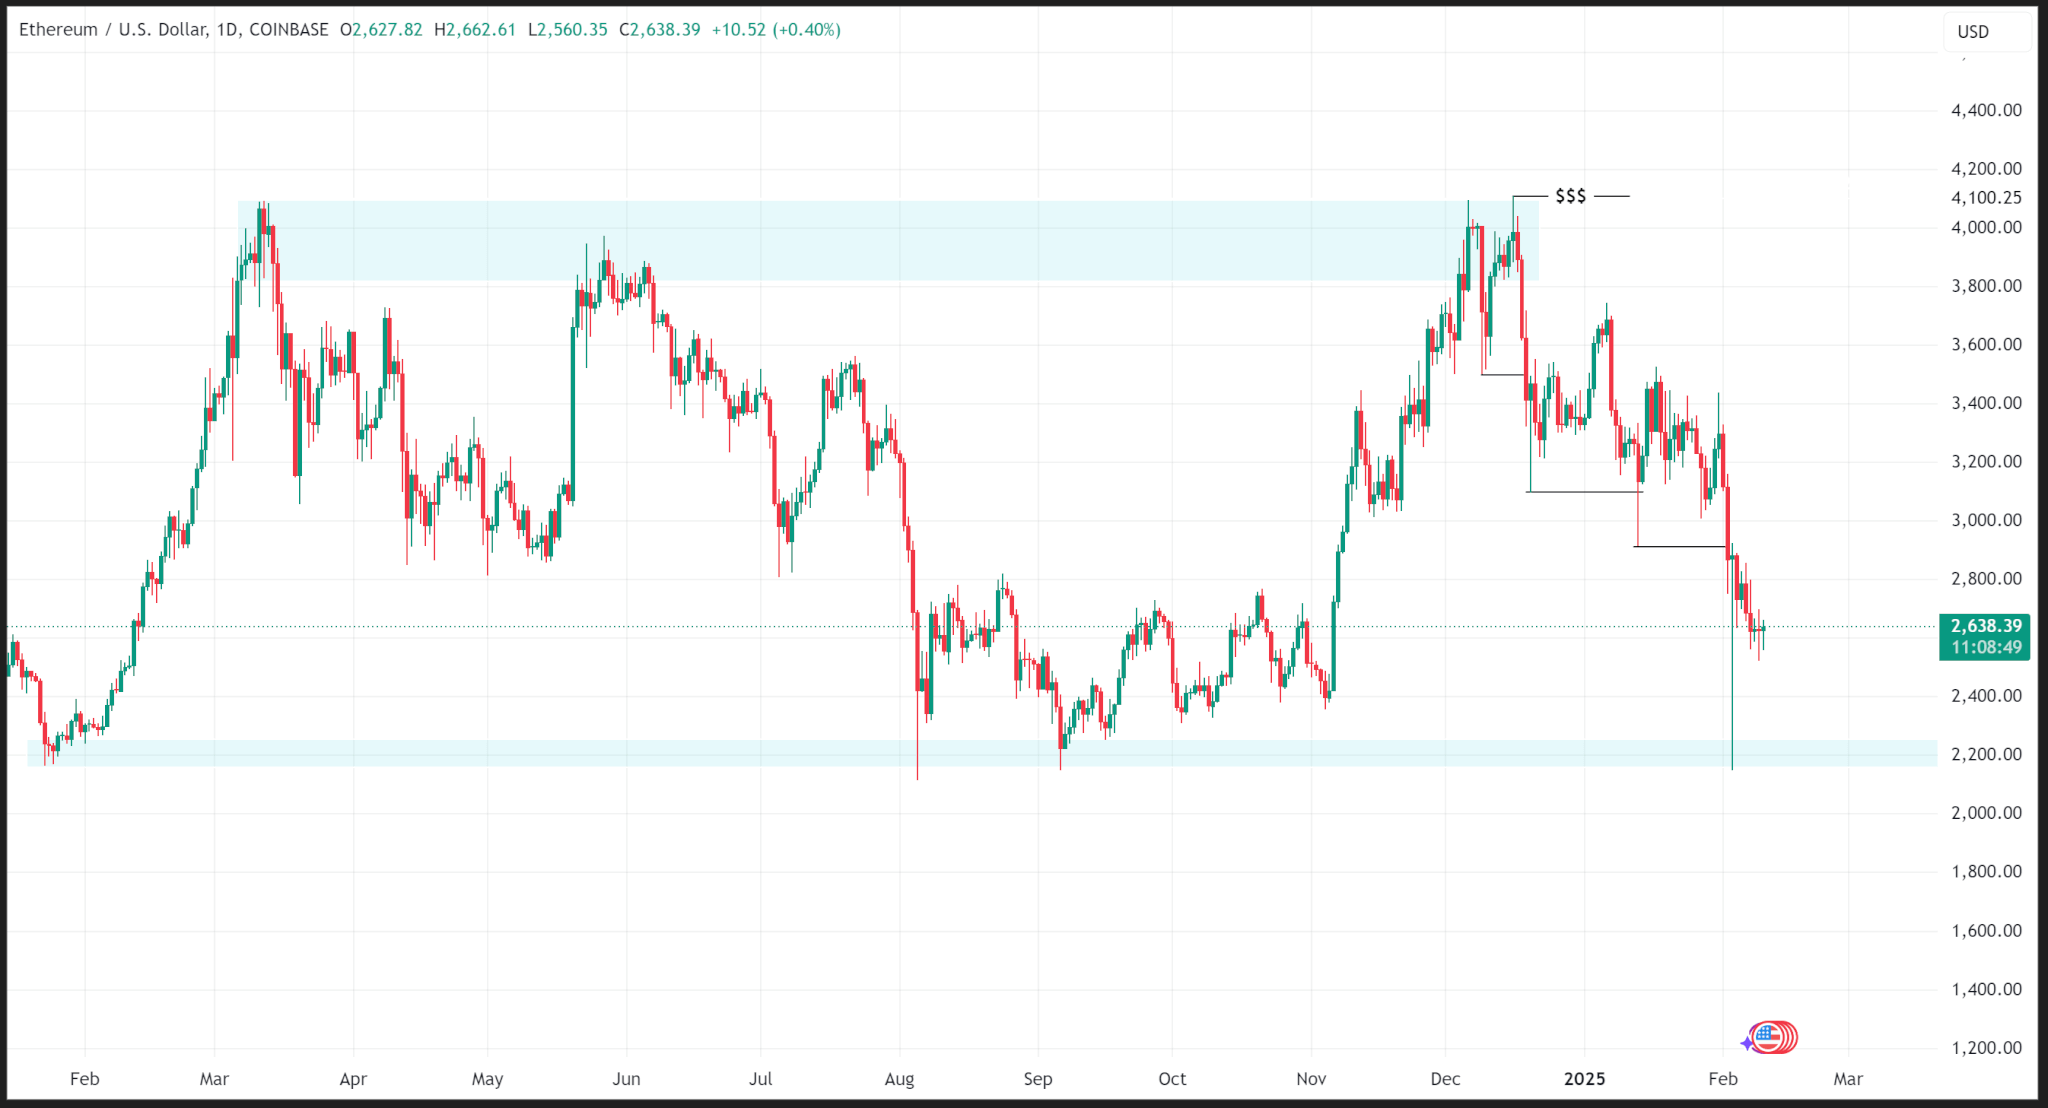
ETH trades at $2,640.05 as of publishing.
