
Bitcoin’s realized volatility has fallen to 17.2%, one of its lowest levels in recent months. Multiple Bitcoin analysts have said that long periods of price compression, alongside declining volatility, have historically preceded double-digit rallies.
Bitcoin realized volatility is down 56% in Q2
Bitcoin researcher Axel Adler Jr. said that BTC’s one-week realized volatility, smoothed over a 30-day period, has fallen to 17.2% from 39% this quarter, a 56% decline.
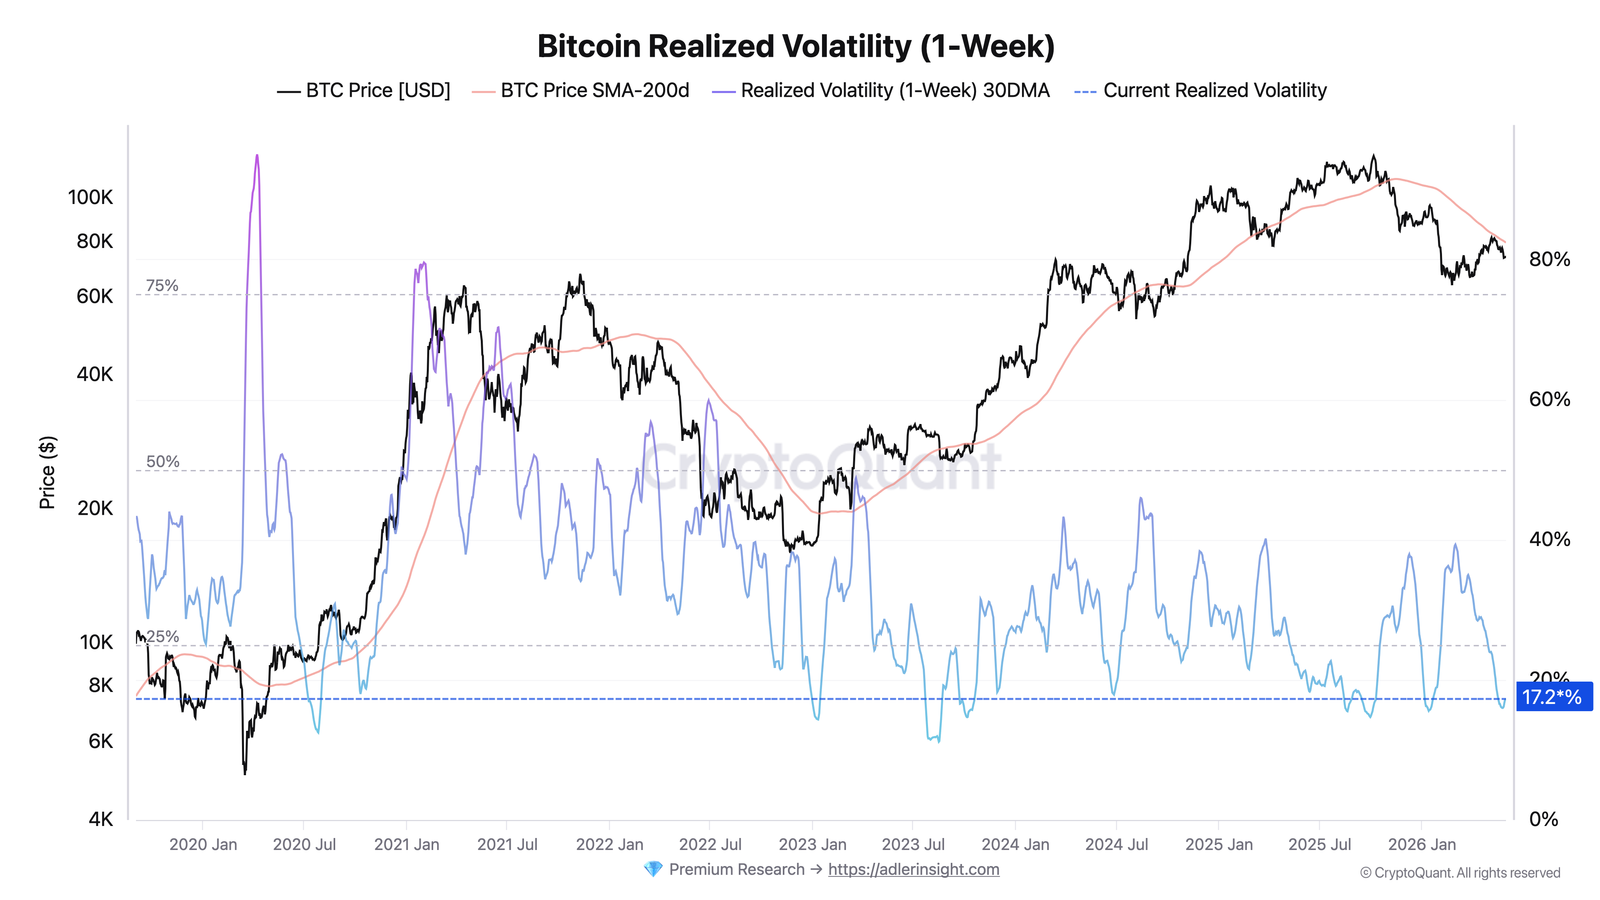
Bitcoin realized volatility (one-week). Source: CryptoQuant
The realized volatility, which measures how much the price has actually moved over a given period, sits well below its long-term median of 40%. Adler explained that such volatility compression may lead to a major price move.
However, the metric does not indicate direction. Instead, it measures how much momentum is building while the price movement slows.
The long-term volatility gauges tell a similar story. Three-month realized volatility has fallen to 80% from 109% since early April, while six-month realized volatility declined to 127% from 148%.
The drop across multi-time-frame volatility measures indicates that price movement has become compressed, a condition that may precede larger market moves.
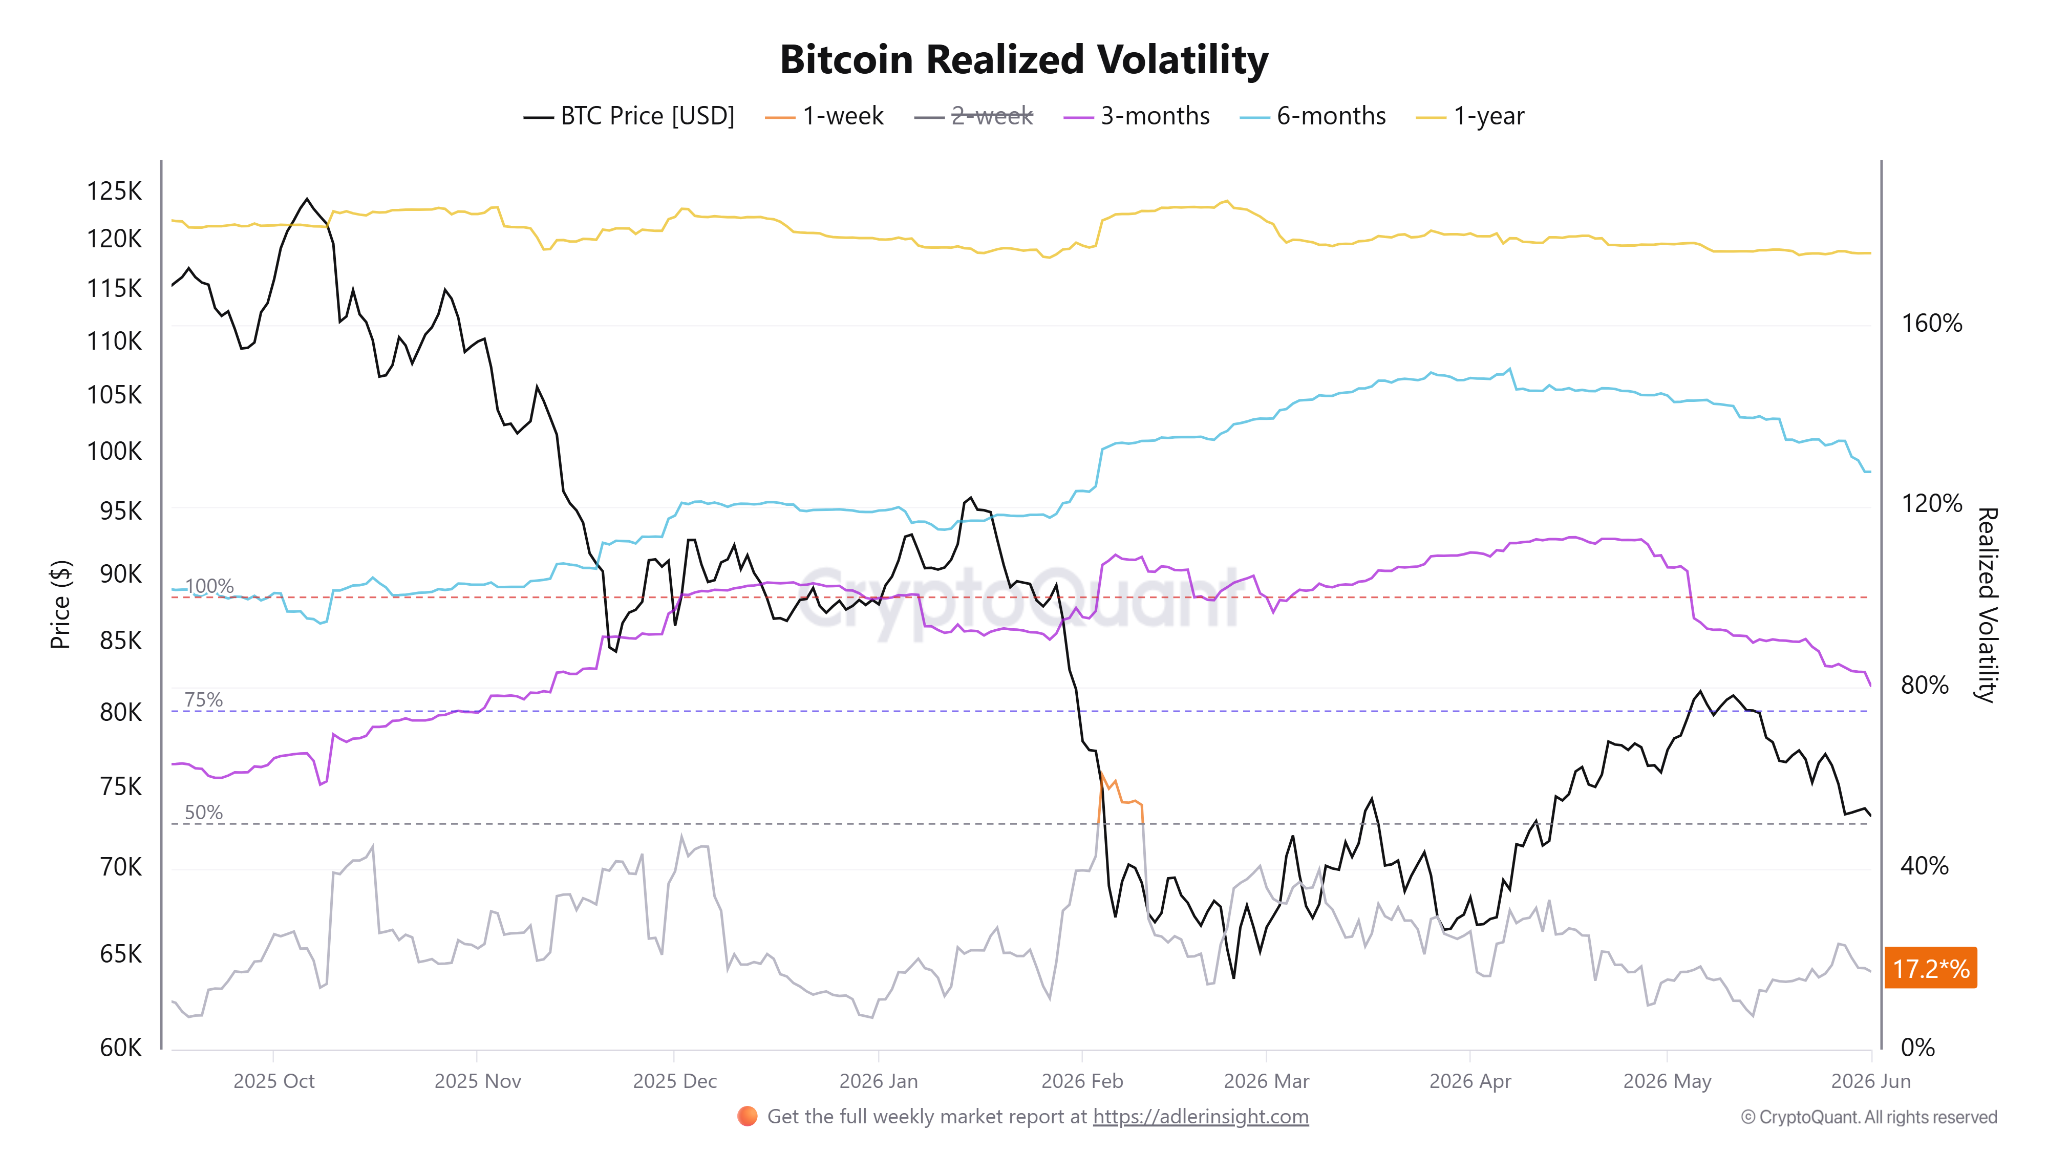
Bitcoin three- and six-month realized volatility. Source: CryptoQuant
The network valuation data adds another layer. The Bitcoin growth rate metric, which compares market capitalization growth to realized capitalization, has remained negative for more than six months. The delta, or 365-day moving average, recently slipped to -0.0013, indicating that BTC’s market value is growing more slowly than its realized value.
Adler said that the data points to a cooling market. Bitcoin’s price is not rising as quickly as the capital flowing into the network, suggesting investors are becoming more cautious amid reduced market volatility.
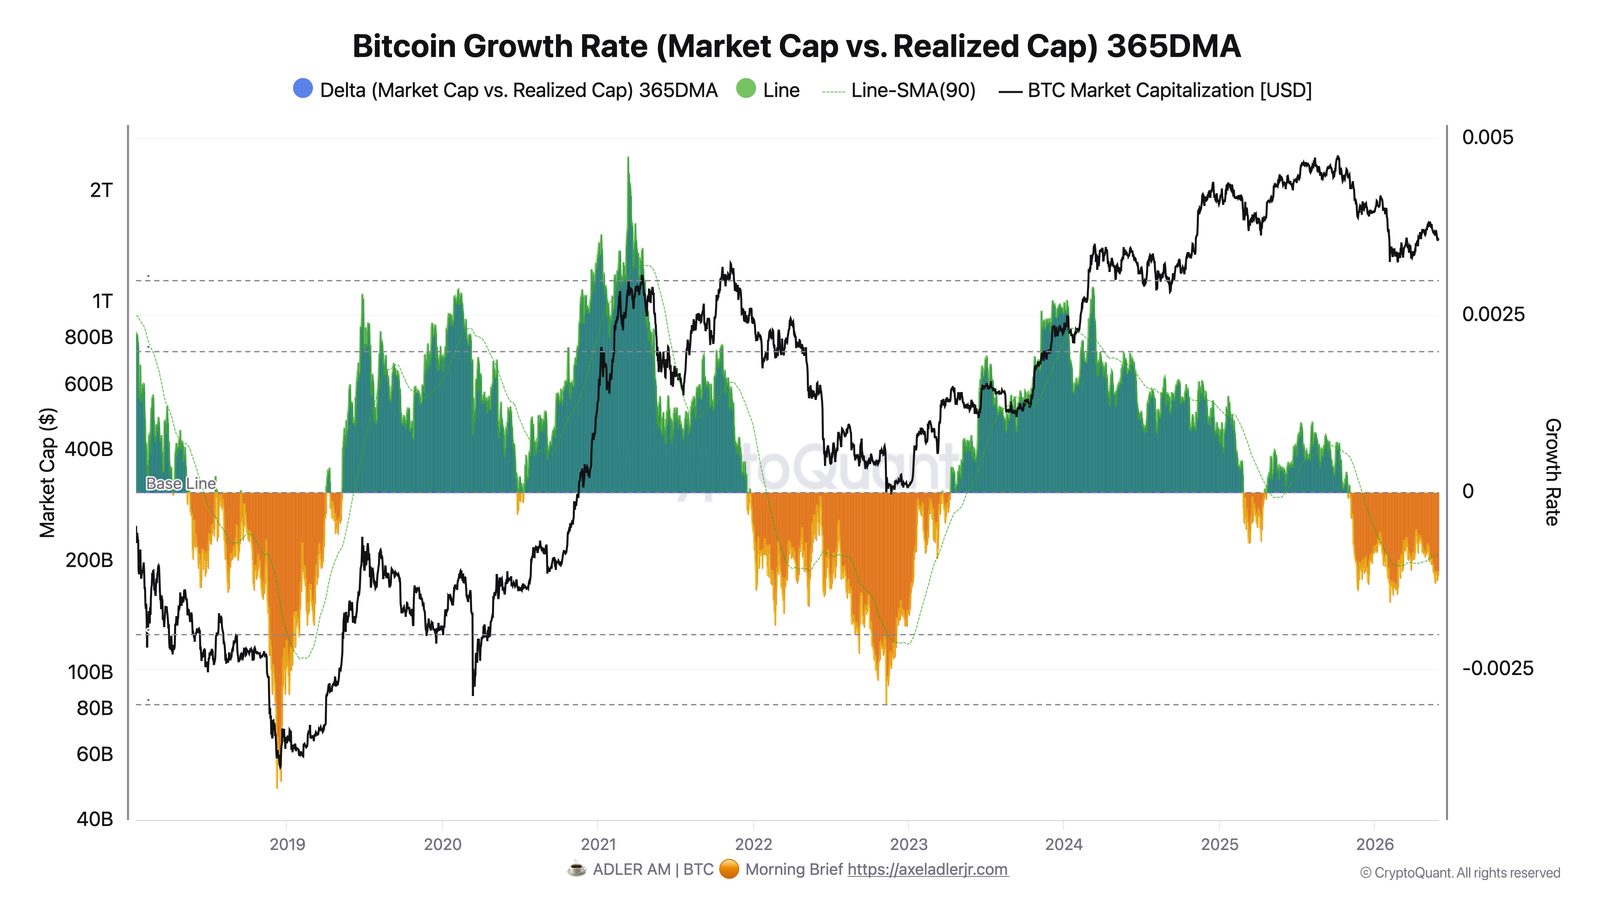
Bitcoin growth rate based on market cap and realized cap. Source: CryptoQuant
Related: Bitcoin price targets $78K as BTC holders defend ‘strongest near-term support’
Bitcoin enters a “tug-of-war” phase, says analyst
CryptoQuant analyst Maartunn said Bitcoin has spent 114 days trading within a broad range of $60,000 and $80,000, while the Bitcoin volatility index has dropped toward multi-month lows near 0.90.
According to Maartunn, similar periods of compression have historically preceded 10% to 20% moves once the price range breaks.
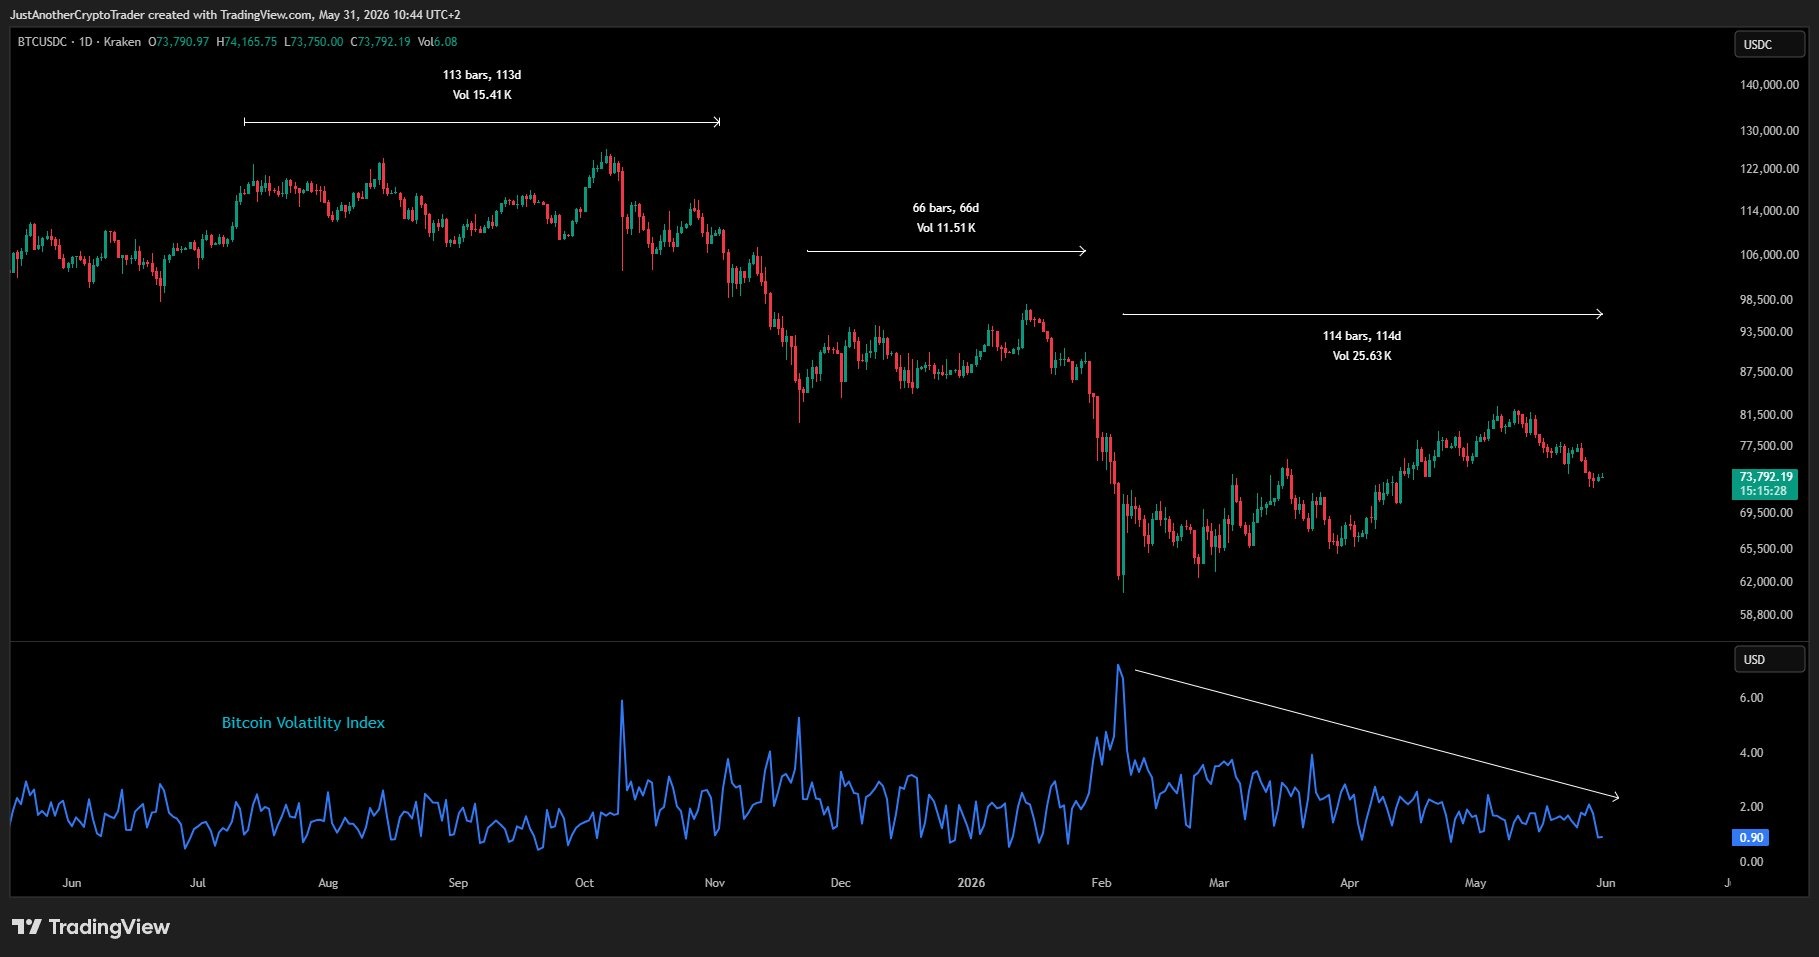
BTC price and volatility index analysis by Maartunn. Source: X
MN Capital founder Michael van de Poppe remained bullish on BTC, stating the current area as a key support zone. Van de Poppe said,
“If history repeats itself, that means that we’re going to see two great weeks of upwards momentum for Bitcoin and the end of this correction. It’s a crucial support zone for Bitcoin, which needs to hold in order to prevent a test at $61,000 to happen.”
Meanwhile, CryptoQuant analyst Amr Taha pointed to a growing split in market behavior. Binance’s 30-day Bitcoin inflows rose by roughly $5.6 billion since April across both retail and whale cohorts. Retail inflows increased by $3.6 billion, surpassing the $2 billion rise from whale wallets.
At the same time, wallets holding between 1,000 and 10,000 BTC accumulated 55,450 BTC on May 30, marking their strongest accumulation activity since February. Taha added,
“For Bitcoin, this points to a tug-of-war phase. Exchange inflows are increasing, which may create near-term selling pressure, but large wallet accumulation is also returning, which could provide underlying support if demand remains strong.”
Related: Trump says Iran will ‘work out well’: Five things to know in Bitcoin this week