
Bitcoin (BTC) has trended up for 90 days and is seeing a “bull market rally,” analysis says.
Key points:
- Bitcoin has trended up for 90 days within its bear market — something that has never happened before.
- Analysis thus sees price as being in a “bull market rally,” with February’s macro lows untouched.
- Separate commentary calls for a reclaim of the weekly supertrend nearer to $90,000 to confirm that bulls are back.
Bitcoin internal bear-market uptrend makes history
In a post on X on Thursday, trader and analyst Matthew Hyland said that Bitcoin’s recent rebound from macro lows has been unlike any other in history.
“This BTC rally resembles a bull market rally NOT a bear market rally,” he summarized.
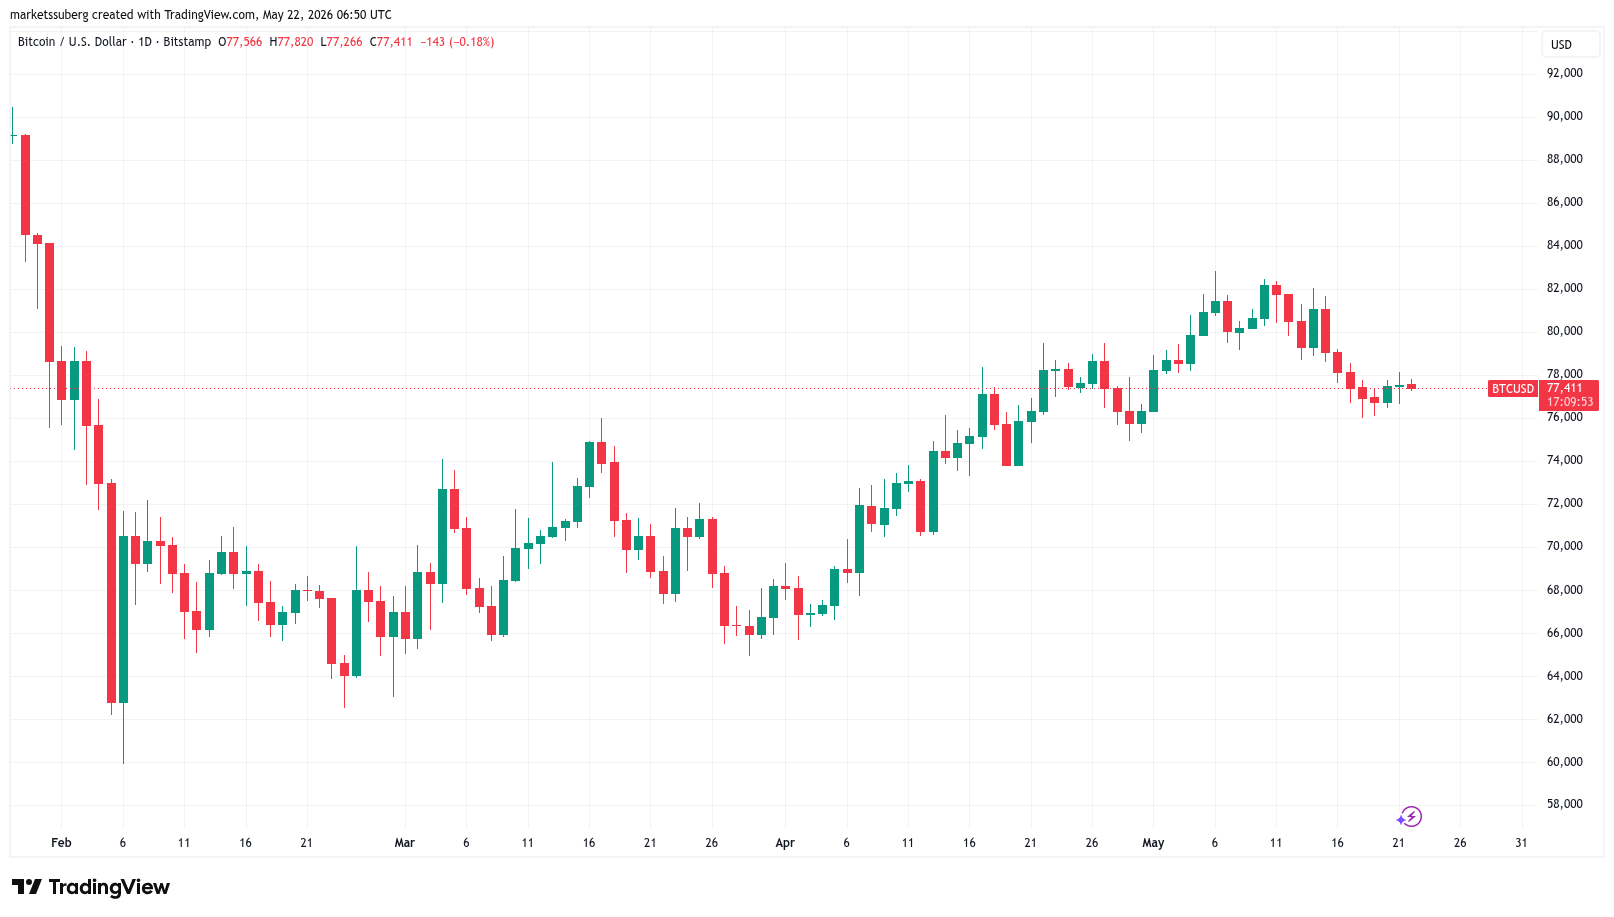
BTC/USD one-day chart. Source: Cointelegraph/TradingView
According to Hyland, BTC/USD has been in a fresh uptrend since the last week of February. At the start of the month, the pair briefly fell below $60,000, hitting its lowest levels since late 2024.
Since then, relief has taken over, with Bitcoin reaching local highs near $83,000 exactly three months after the February bottom, data from TradingView confirms.
“There has NEVER been a rally that trended upward for 89 days ever in a bear market in BTC history,” he continued.
“The break of high time frame resistance also has marked the start of a bull market rally the prior three times.”
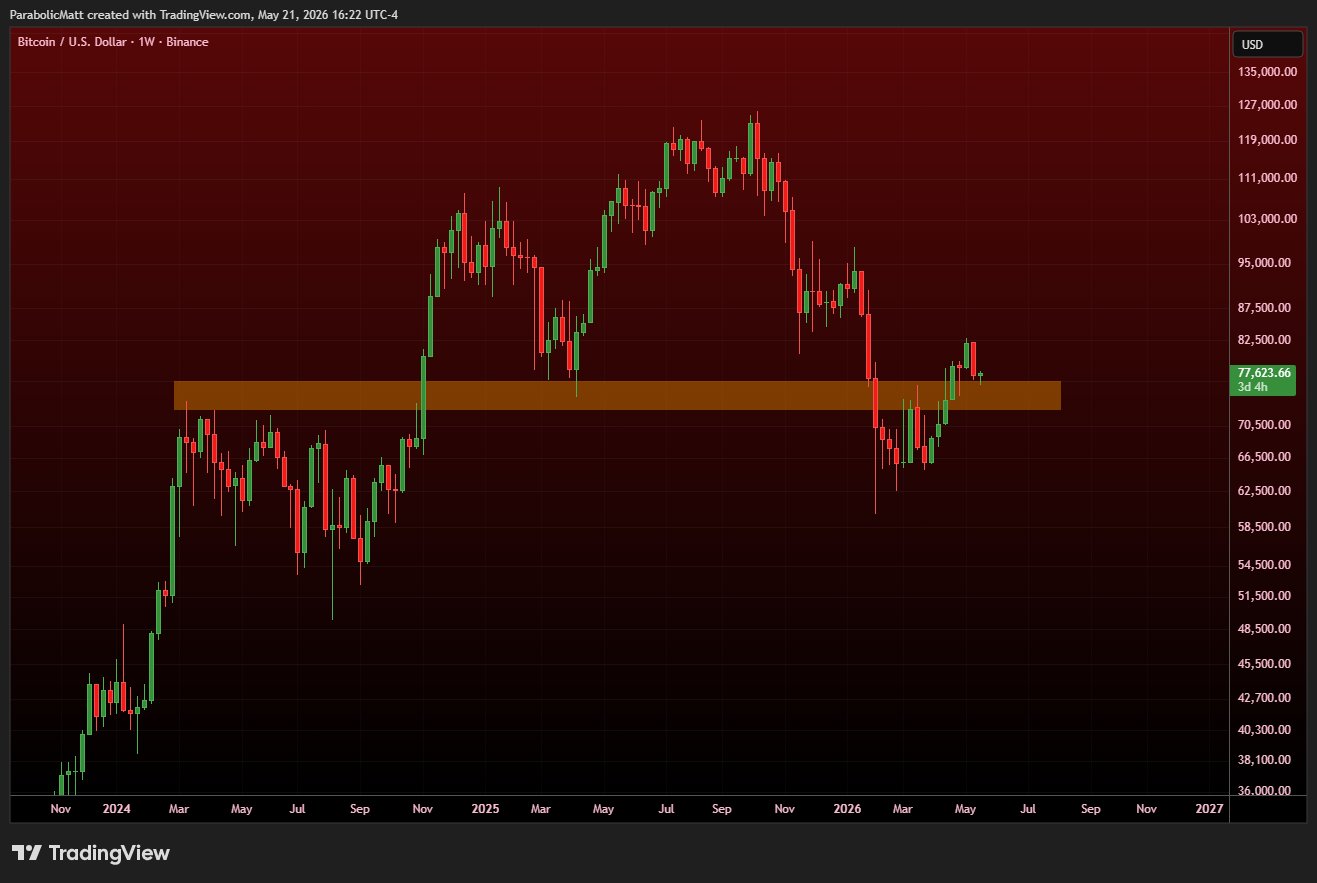
BTC/USD one-week chart. Source: Matthew Hyland/X
An accompanying chart shows that resistance was cleared when the price first broke above and held $77,000.
“Both of these characteristics are characteristics of a bull market rally NOT a bear market rally,” Hyland reiterated.
Analyst: BTC price needs $88,000 rebound
On the topic of bear market expirations, independent analyst Filbfilb demands a higher resistance reclaim for confirmation that bulls are back in control.
Related: Bitcoin due ‘5%+’ move as analysis stays bullish on BTC price outlook
Bitcoin’s weekly supertrend, currently near $90,000, is the line in the sand to watch.
“The last 2 BTC bear markets ended with a >+20% weekly candle and a break of the weekly super trend – presently around $ 88k,” he told X followers.
“If the bearish move we see in play at the moment fails, I’m expecting one of those candles to happen rather than much messing about around these levels.”
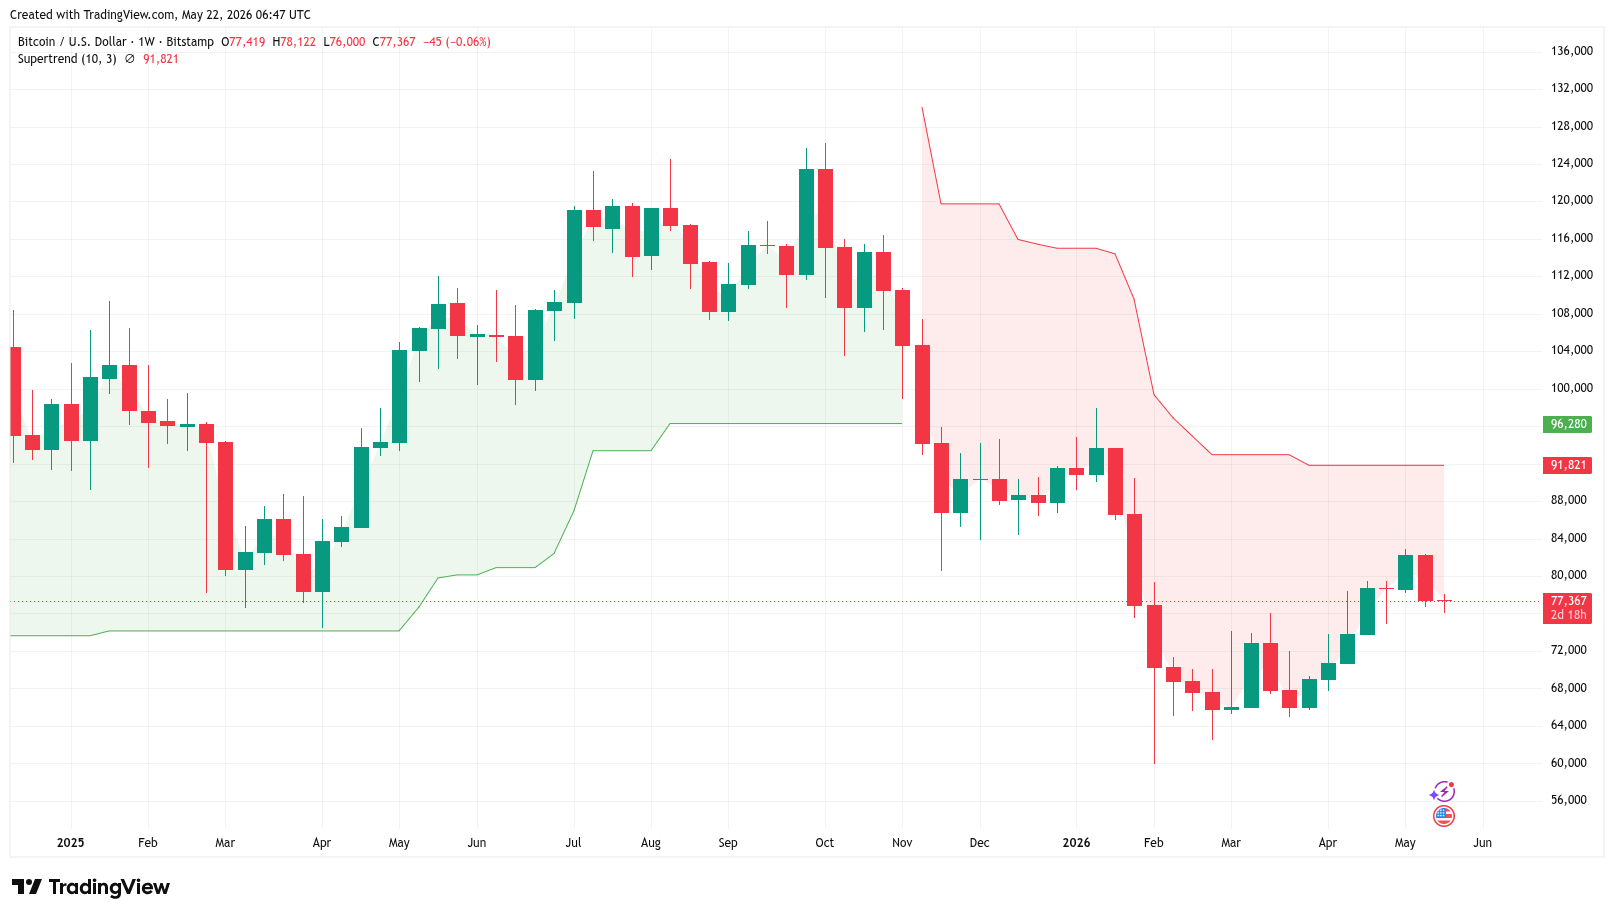
BTC/USD one-week chart with supertrend data. Source: Cointelegraph/TradingView
The super trend is calculated using the average true range of price, coupled with a multiplier. BTC/USD last had a weekly close above the supertrend line in early November 2025.