
Bitcoin (BTC) focused on $77,000 on Thursday as analysis eyed a minimum 5% BTC price move.
Key points:
- Bitcoin waits for a breakout move as it circles the $77,000 mark.
- Analysis sees risk in shorting price at current levels, with bears in the firing line.
- Macro hurdles keep risk assets down across the board, while US bond yields cool.
Trader sees 5% BTC price move “soon”
Data from TradingView showed BTC price action sticking to a narrow range, with leveraged positions on either side of spot.
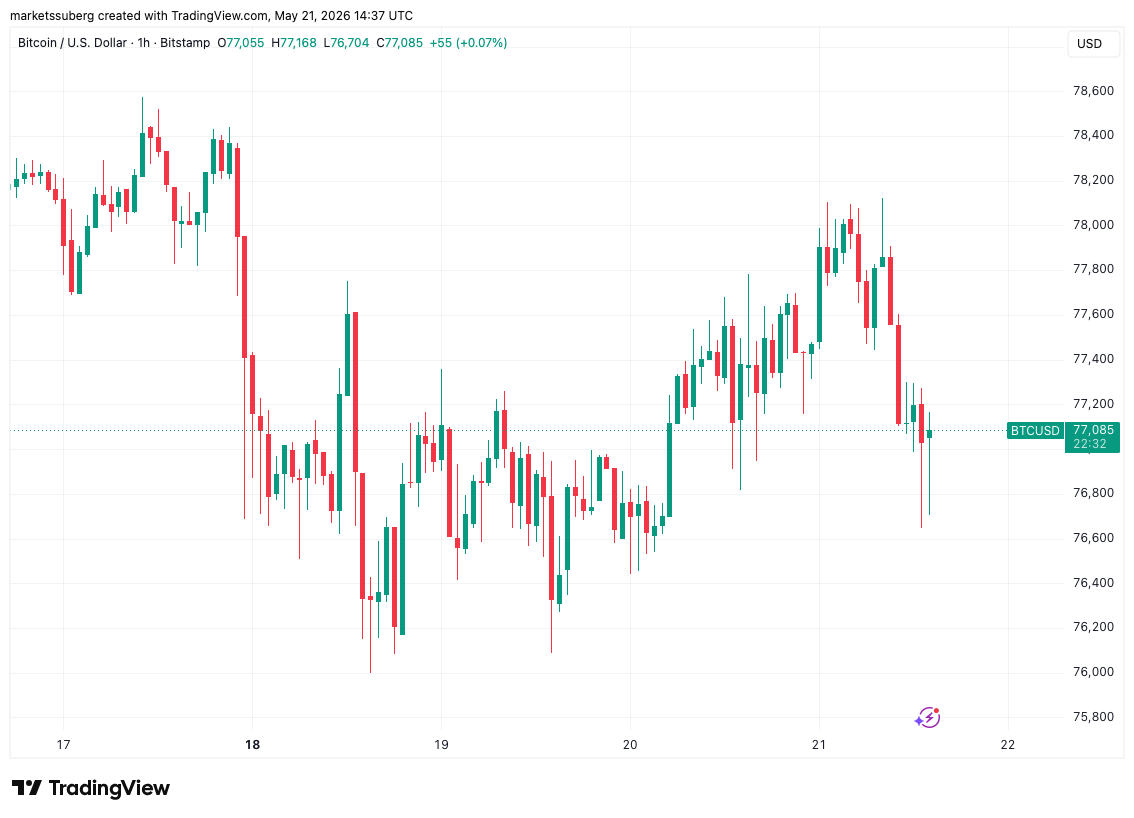
BTC/USD one-hour chart. Source: Cointelegraph/TradingView
“Some big clusters right around price. Most notably: the ~$78K area and the $76.5K-$77K area in the short term,” trader Daan Crypto Trades wrote in his latest analysis on X.
“Price has been in a pretty tight price range the past few days so expecting some larger 5%+ move to occur here soon again.”
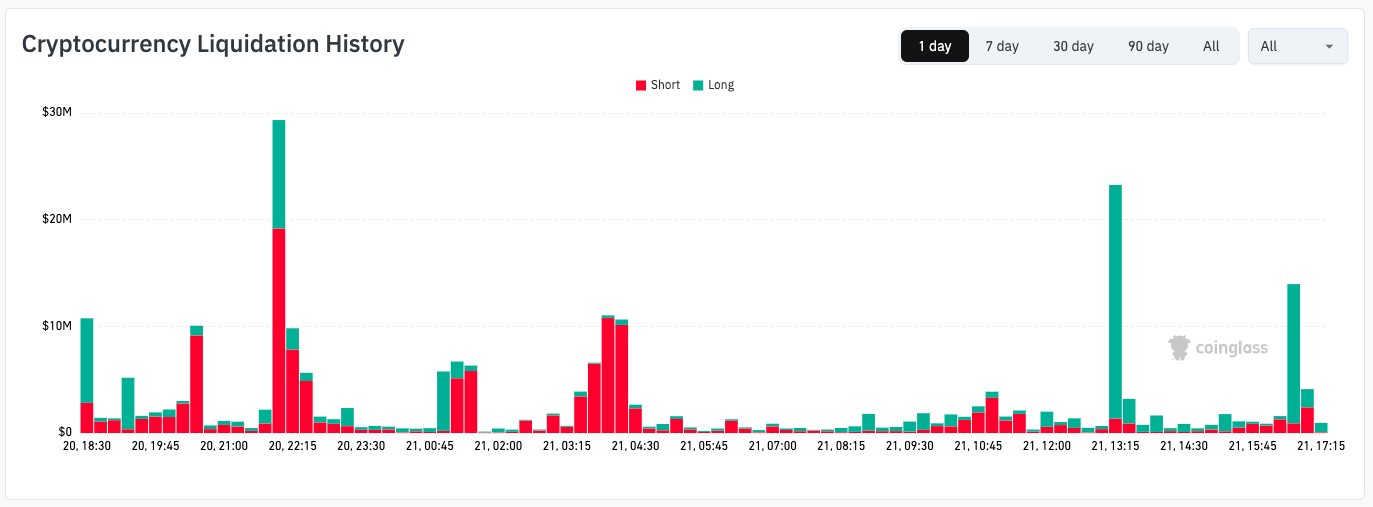
Crypto liquidation history (screenshot). Source: CoinGlass
Data from CoinGlass revealed that short positions had taken the majority of losses across crypto over the 24 hours to the time of writing.
“Bears on $BTC are getting SQUEEZED in real-time,” X analytics account Cryptic Trades commented.
“While the price is going up, the Open-Interest has dropped by over 12K. This is exactly why you don’t short a BULLISH BACKTEST.”
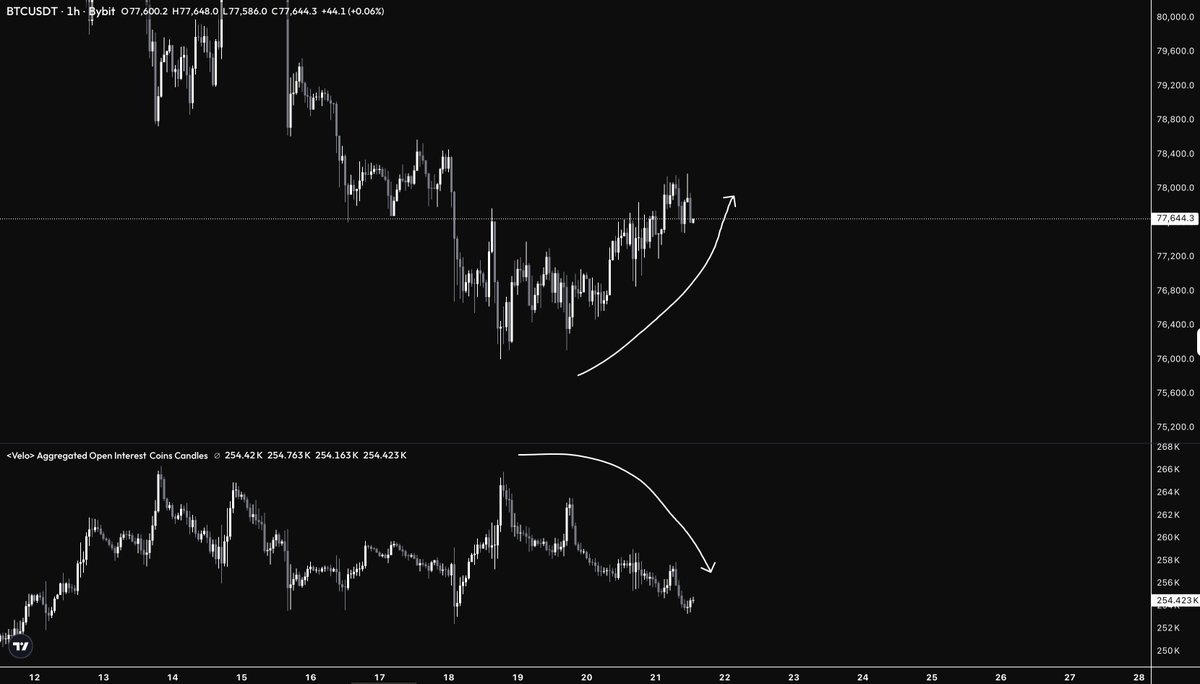
BTC/USDT one-hour chart with open interest data. Source: Cryptic Trades/X
Cryptic Trades remained optimistic about BTC market strength despite the loss of various support levels in recent days. Holding above $74,000, it continued, was the “most likely outcome.”
“Shorting here, or hedging your spot holdings simply doesn’t make sense from a technical perspective, because the market structure remains intact,” it argued.
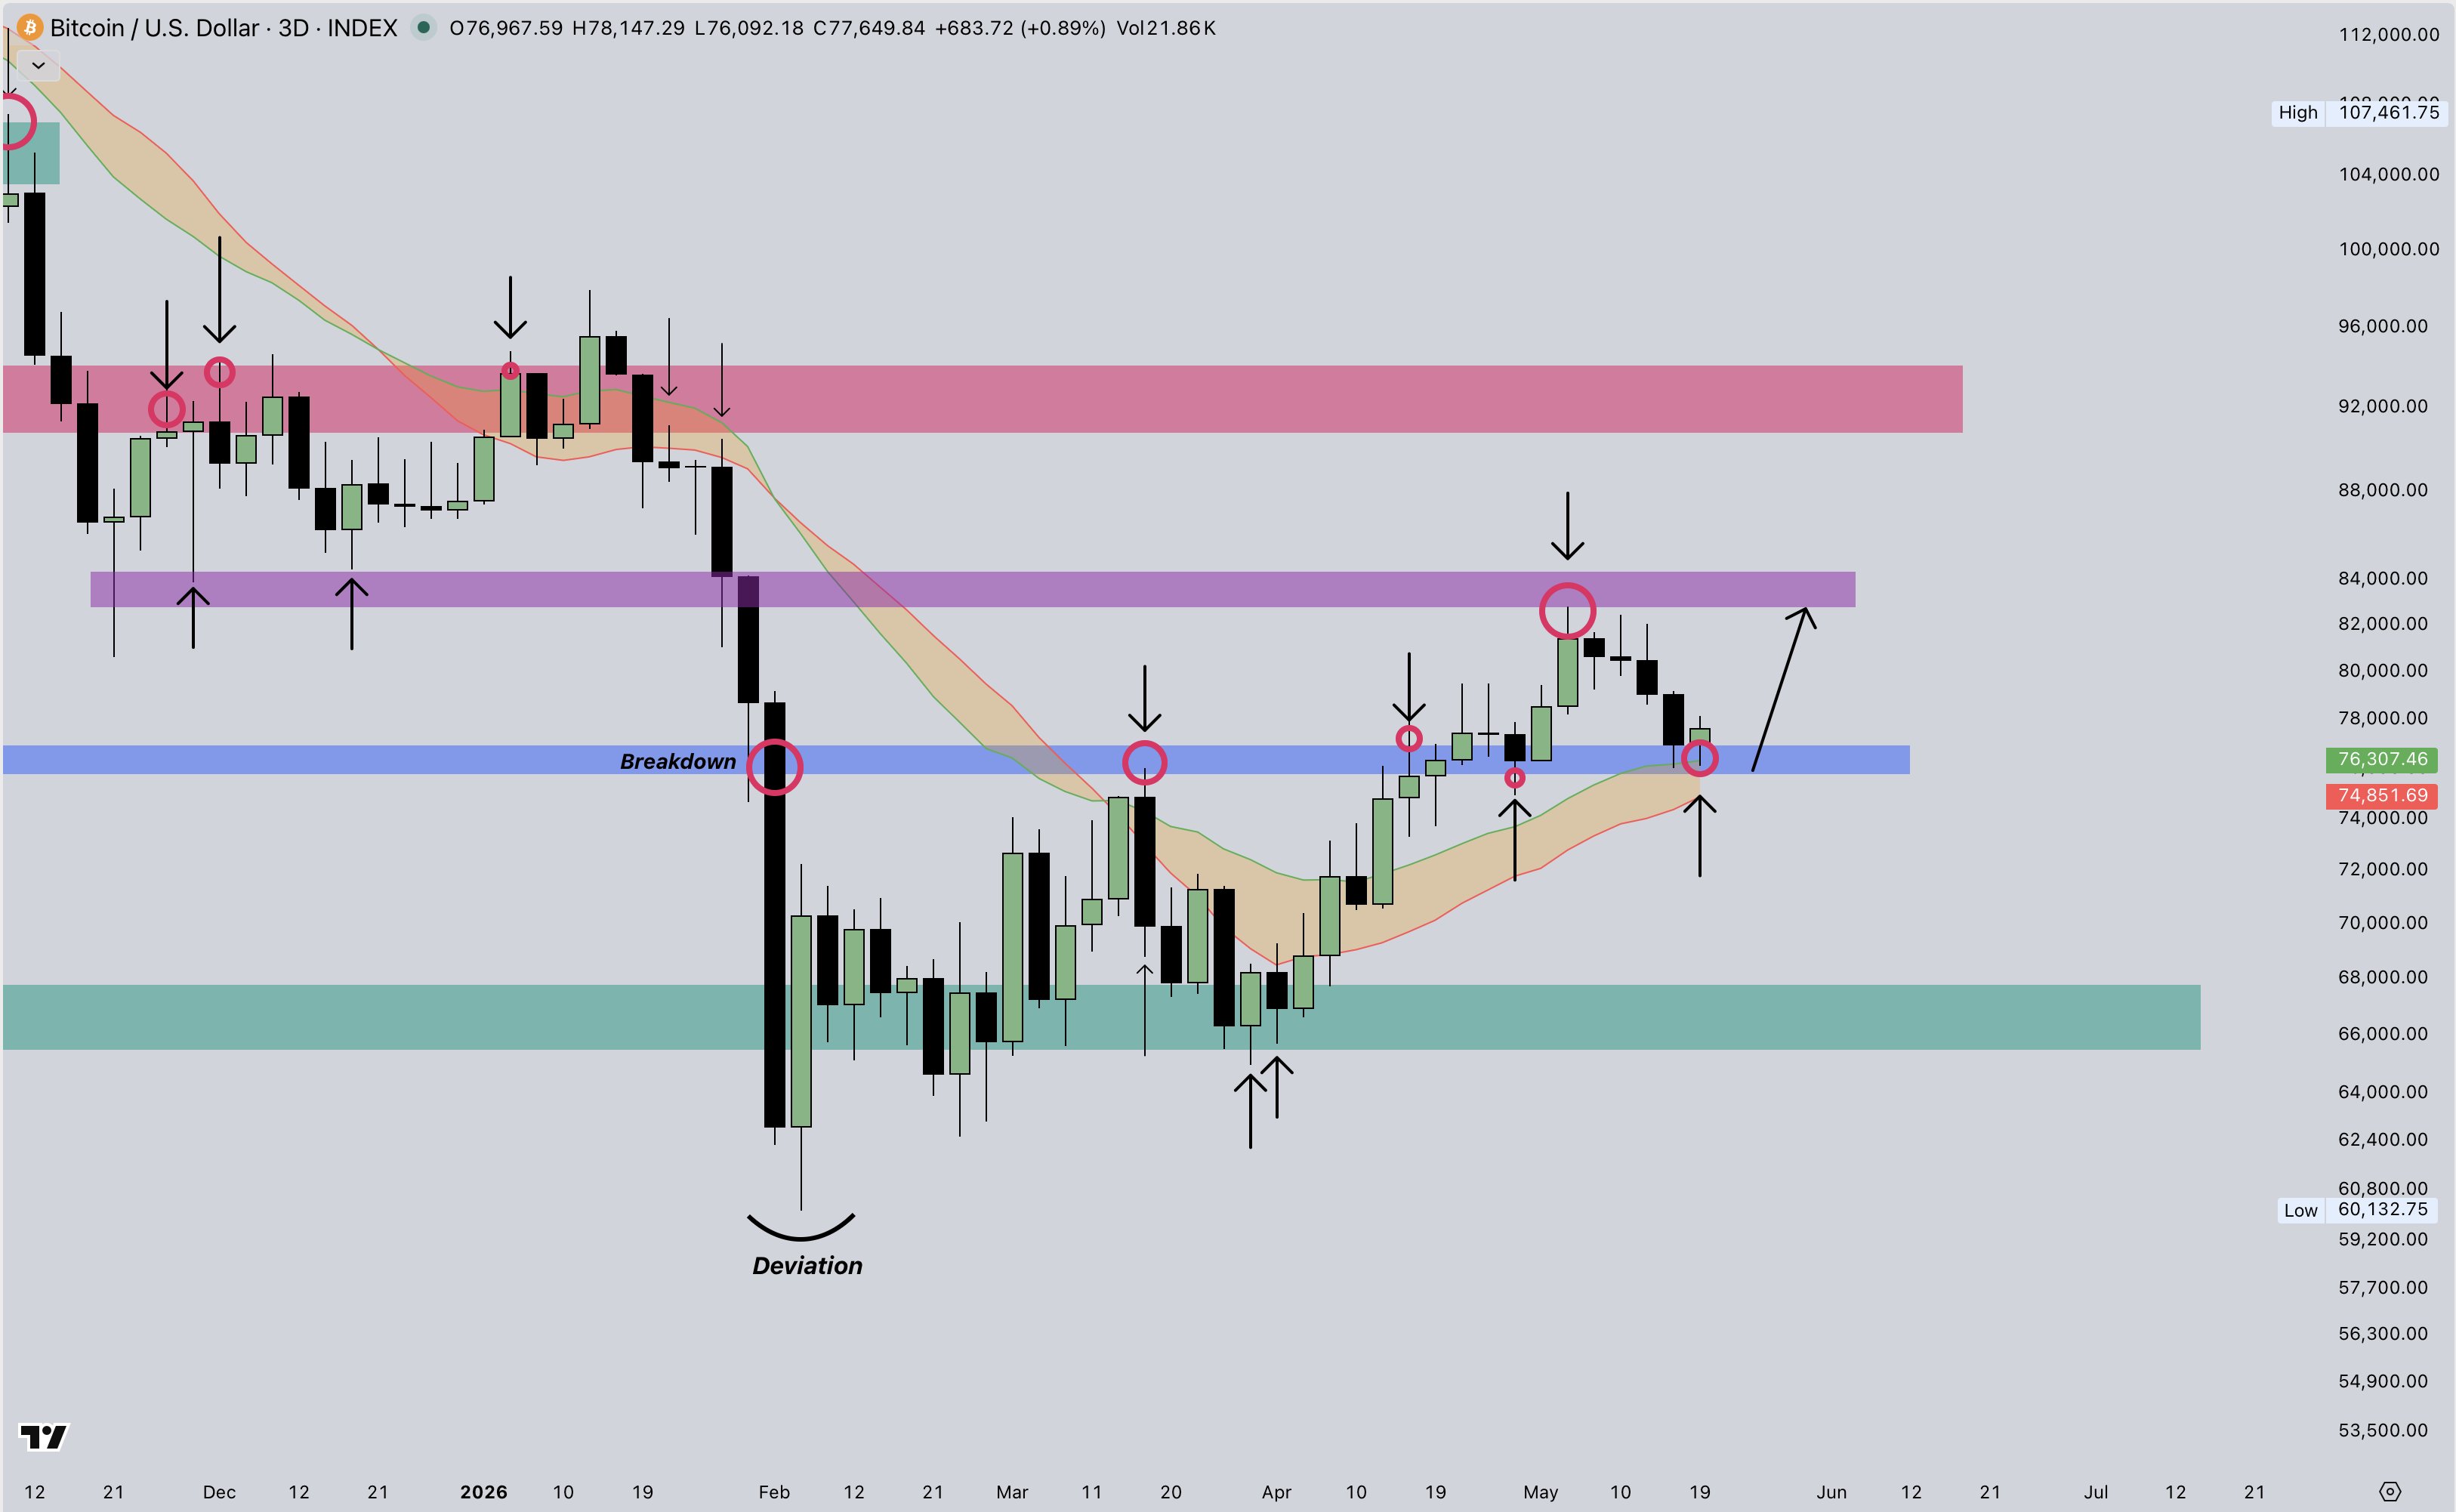
BTC/USD three-day chart. Source: Cryptic Trades/X
Oil returns to triple figures on Iran cues
Bitcoin and other risk assets faced familiar macro headwinds on the day, with WTI oil prices heading back above $100 per barrel.
Related: BTC price ‘bull trap’ at $76.5K? Five things to know in Bitcoin this week
The US-Iran war remained the key catalyst amid mixed reports over uranium enrichment and a permanent toll on oil traffic through the Strait of Hormuz.
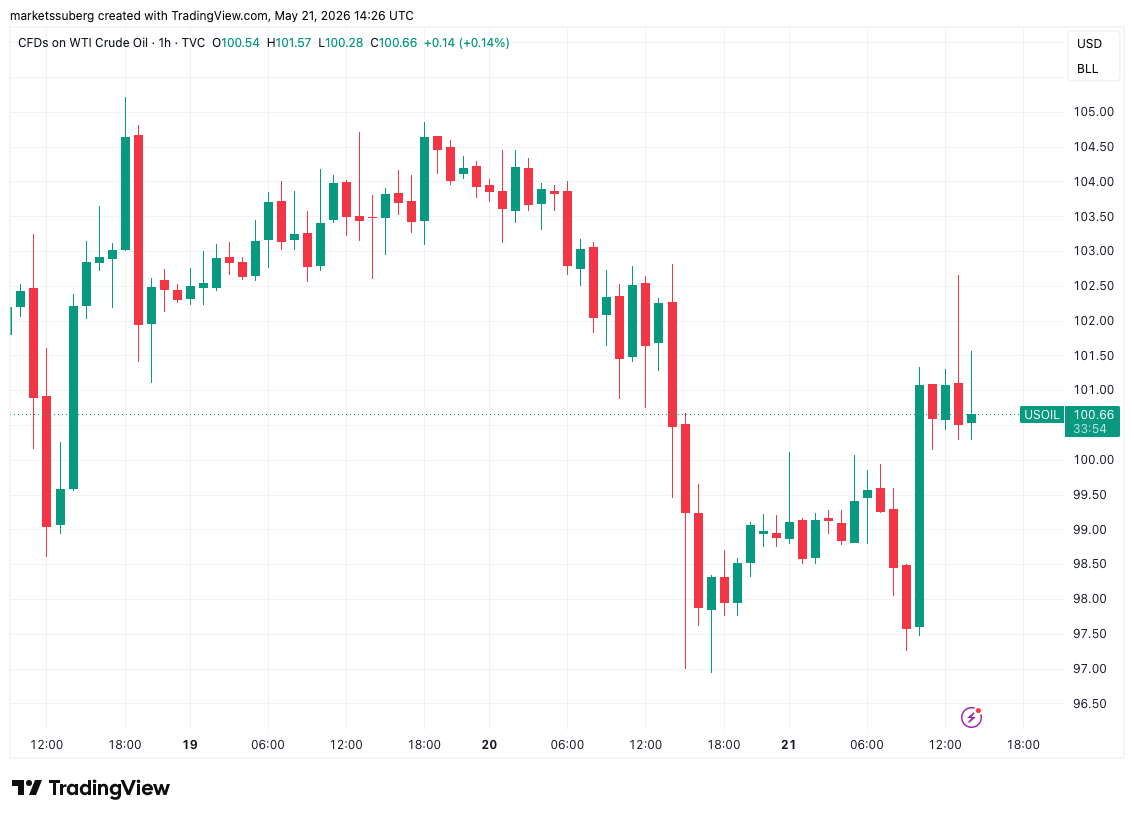
CFDs on WTI crude oil one-hour chart. Source: Cointelegraph/TradingView
The day prior, US President Donald Trump had sent oil and US bond yields lower with hints that an Iran peace deal was near.
“It’s the same recipe, if this trend is prolonged and the deal is likely finalized, you’ll see yields continue to fall even more, especially in Japan,” crypto trader and analyst Michaël Van de Poppe responded.
“If those yields come down –> risk-on assets to rally even higher.”
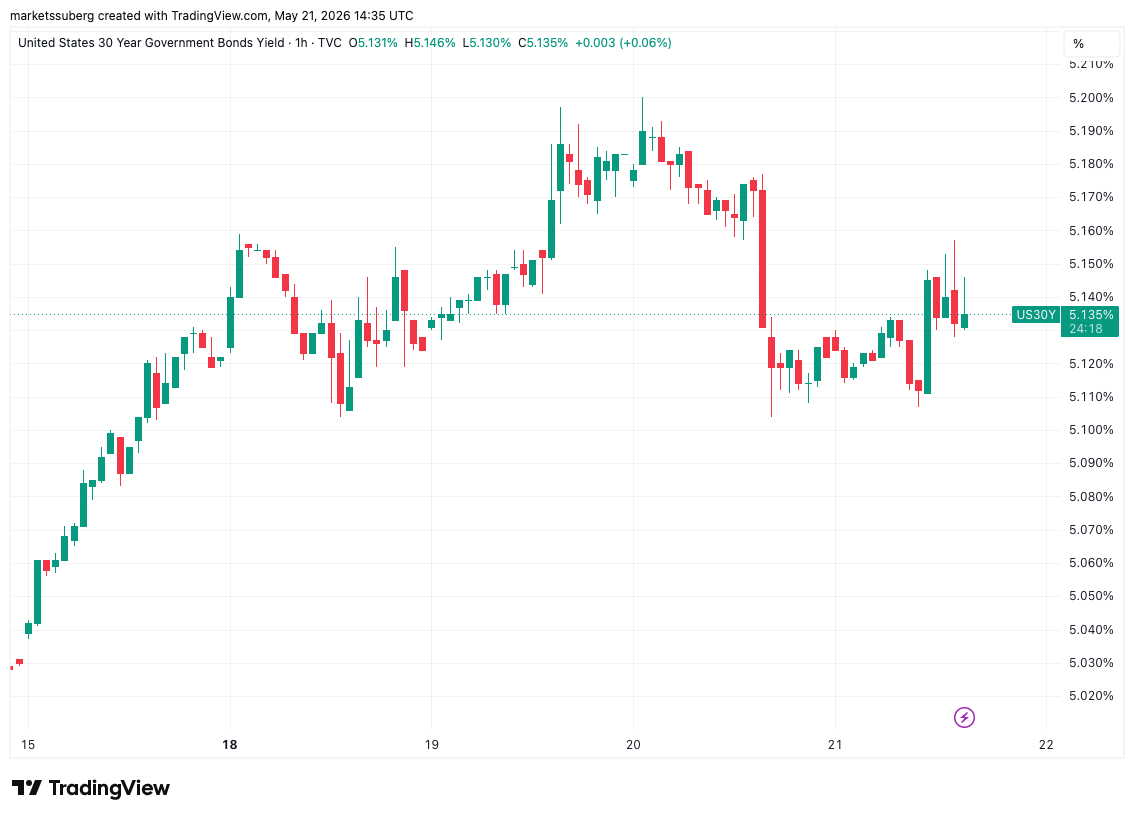
US 30-year treasury yield one-hour chart. Source: Cointelegraph/TradingView