
Demand for Bitcoin (BTC) has decreased sharply over the last few days as the price ran into overhead resistance above $80,000. Analysts say BTC’s inability to hold key support levels may be paving the way for a prolonged consolidation.
Key takeaways:
- Bitcoin’s apparent demand fell to -3,138 BTC, its lowest level in four months.
- Weak spot activity and negative ETF flows pressure the BTC price below $80,000.
- Analysts warn that Bitcoin risks prolonged consolidation or a deeper correction if $78,000 is not broken.
Bitcoin’s apparent demand has dropped to its lowest level since mid-January, as traders and investors adopted a risk-off approach due to geopolitical and macroeconomic uncertainties.
Related: Bitcoin rallies through $77K despite spot BTC ETF outflows topping $2B
Capriole Investment’s Bitcoin Apparent Demand metric shows that demand for Bitcoin has been negative since Dec. 22, 2025 and improved slightly in late February, before reversing sharply to -3,138 BTC on Thursday.
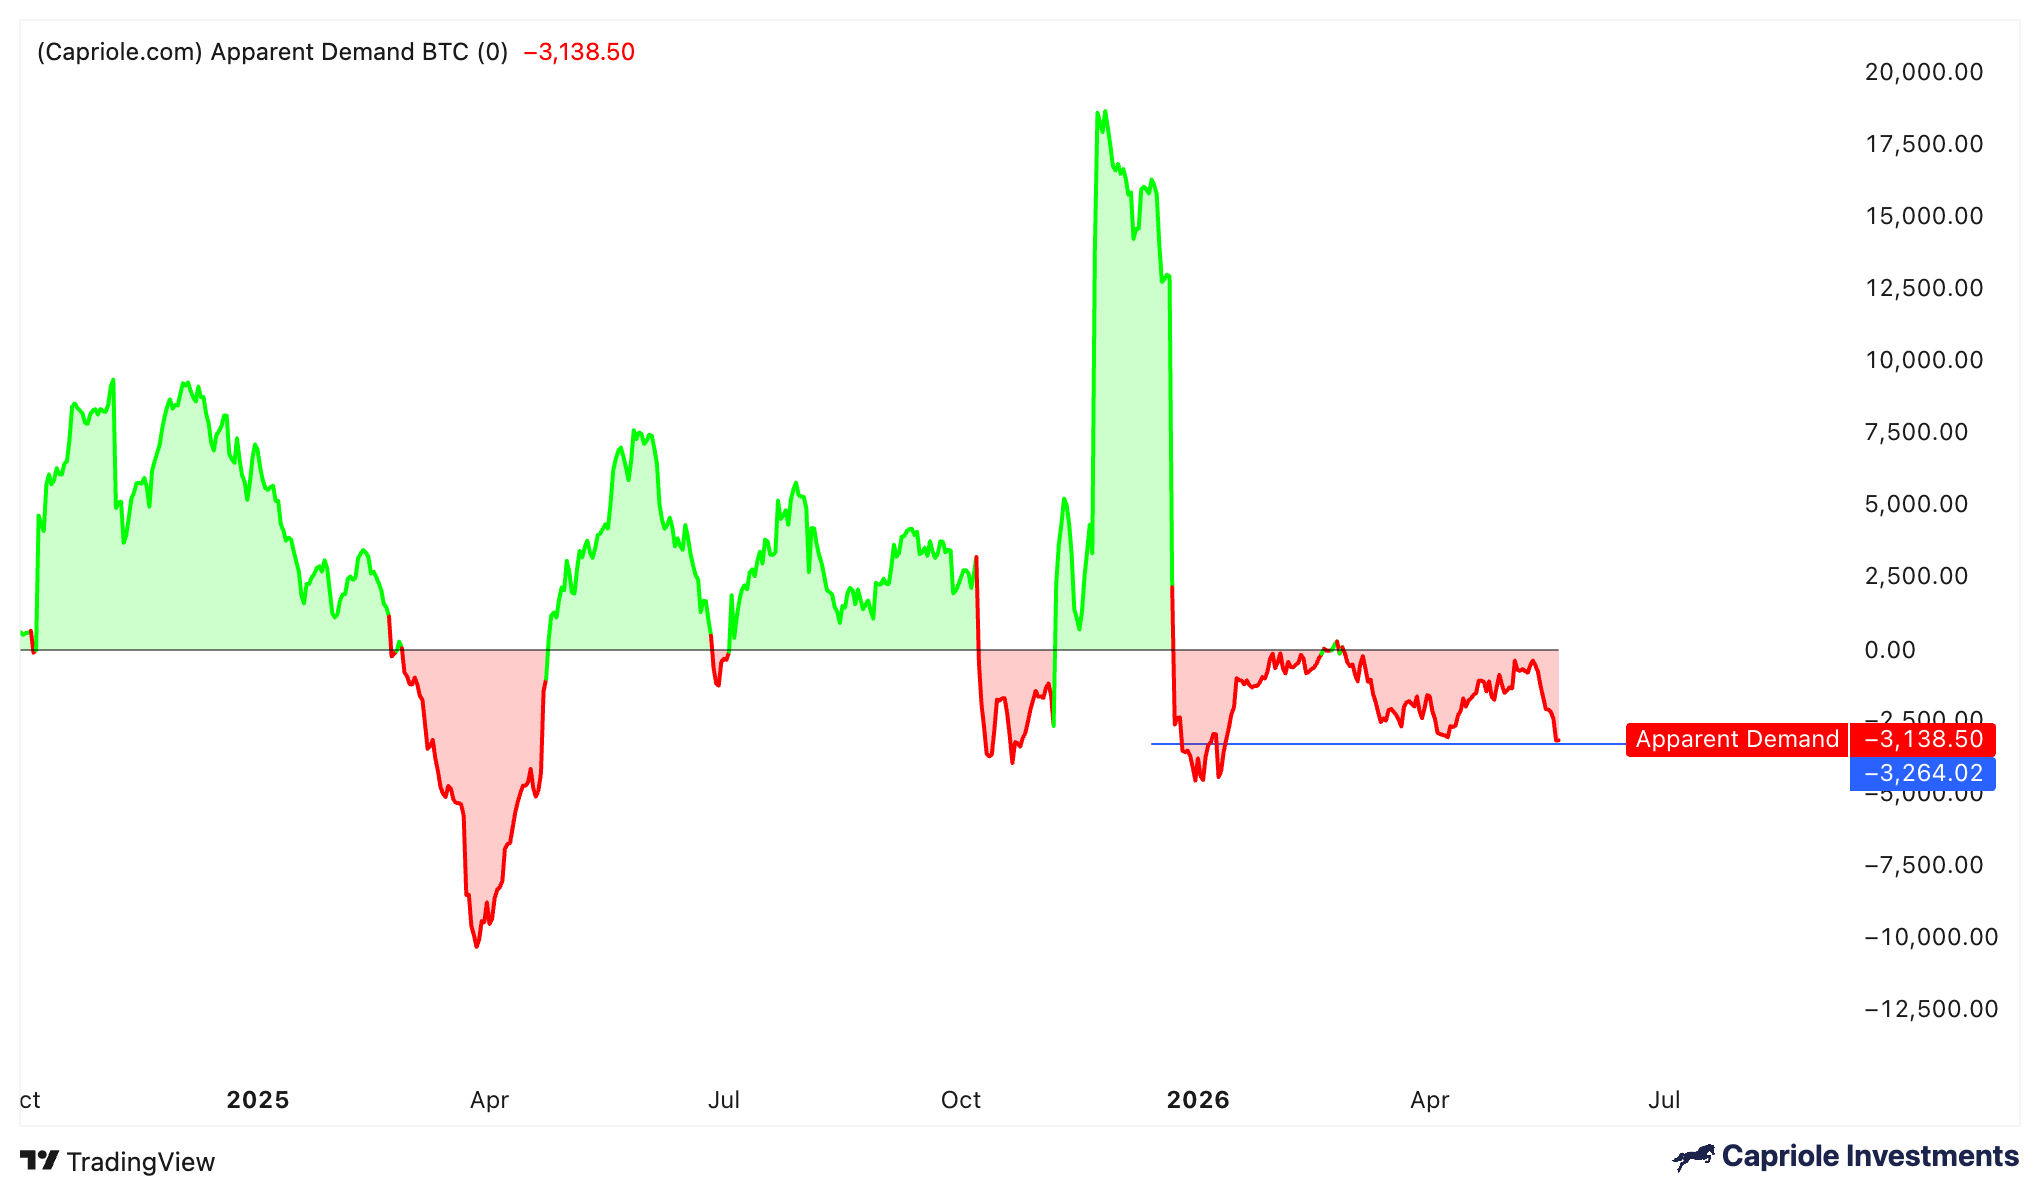
Bitcoin’s apparent demand. Source: Capriole Investments
“Bitcoin’s overall demand has flipped into net contraction,” CryptoQuant said in its latest Weekly Crypto report, adding:
“Spot apparent demand is contracting at a slightly faster pace than in prior weeks.”
Spot market activity has weakened in recent weeks, with the aggregate spot cumulative volume delta (CVD) across all exchanges “remaining negative into the recent pullback toward the high-$70K range,” Glassnode said in its latest Week On-chain newsletter, adding:
“Despite Bitcoin remaining relatively resilient structurally, the latest spot positioning data suggests broad-based spot accumulation has yet to re-emerge.”
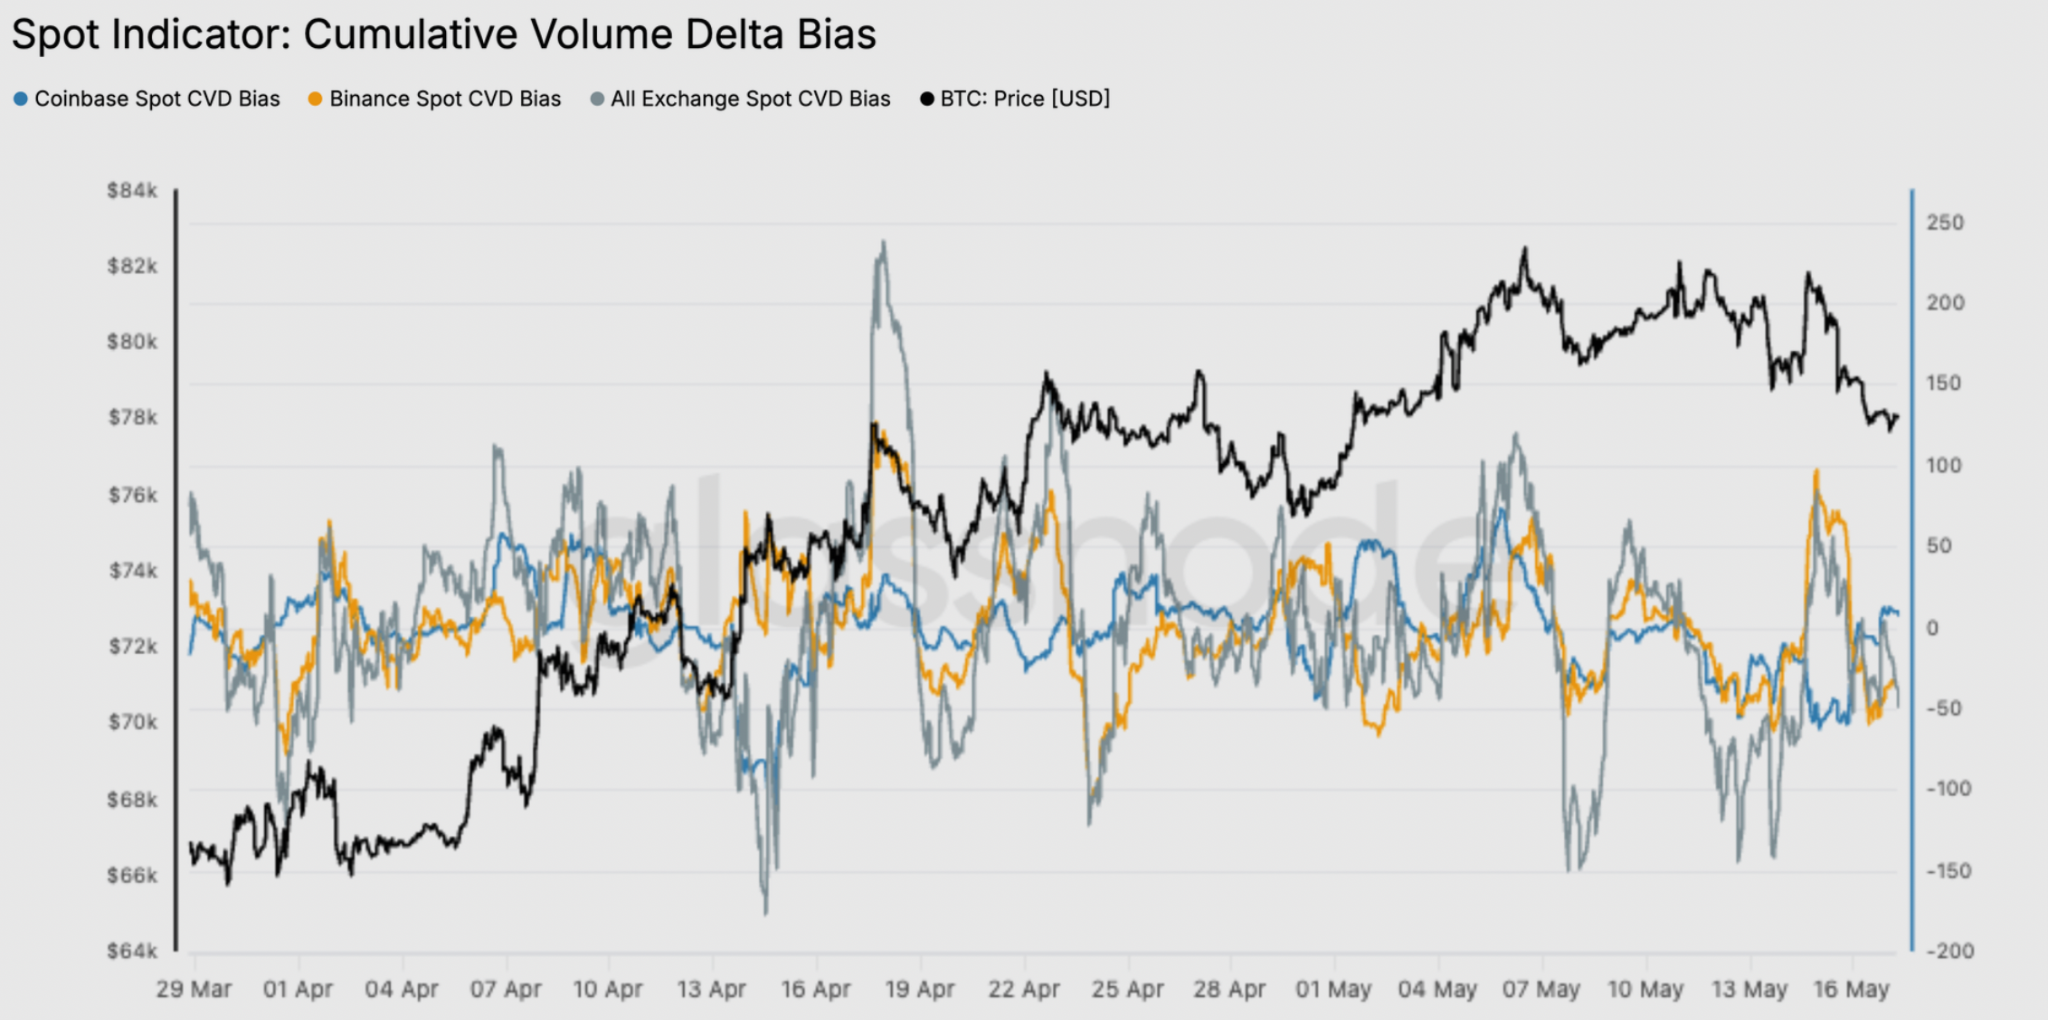
Bitcoin spot CVD. Source: Glassnode
Meanwhile, US-based spot exchange-traded funds (ETFs) also turned net sellers, with the 30-day change in ETF holdings falling to its lowest level in nearly three months.
This suggests that “outright spot demand is becoming less aggressive near the current range highs,” Glassnode added.
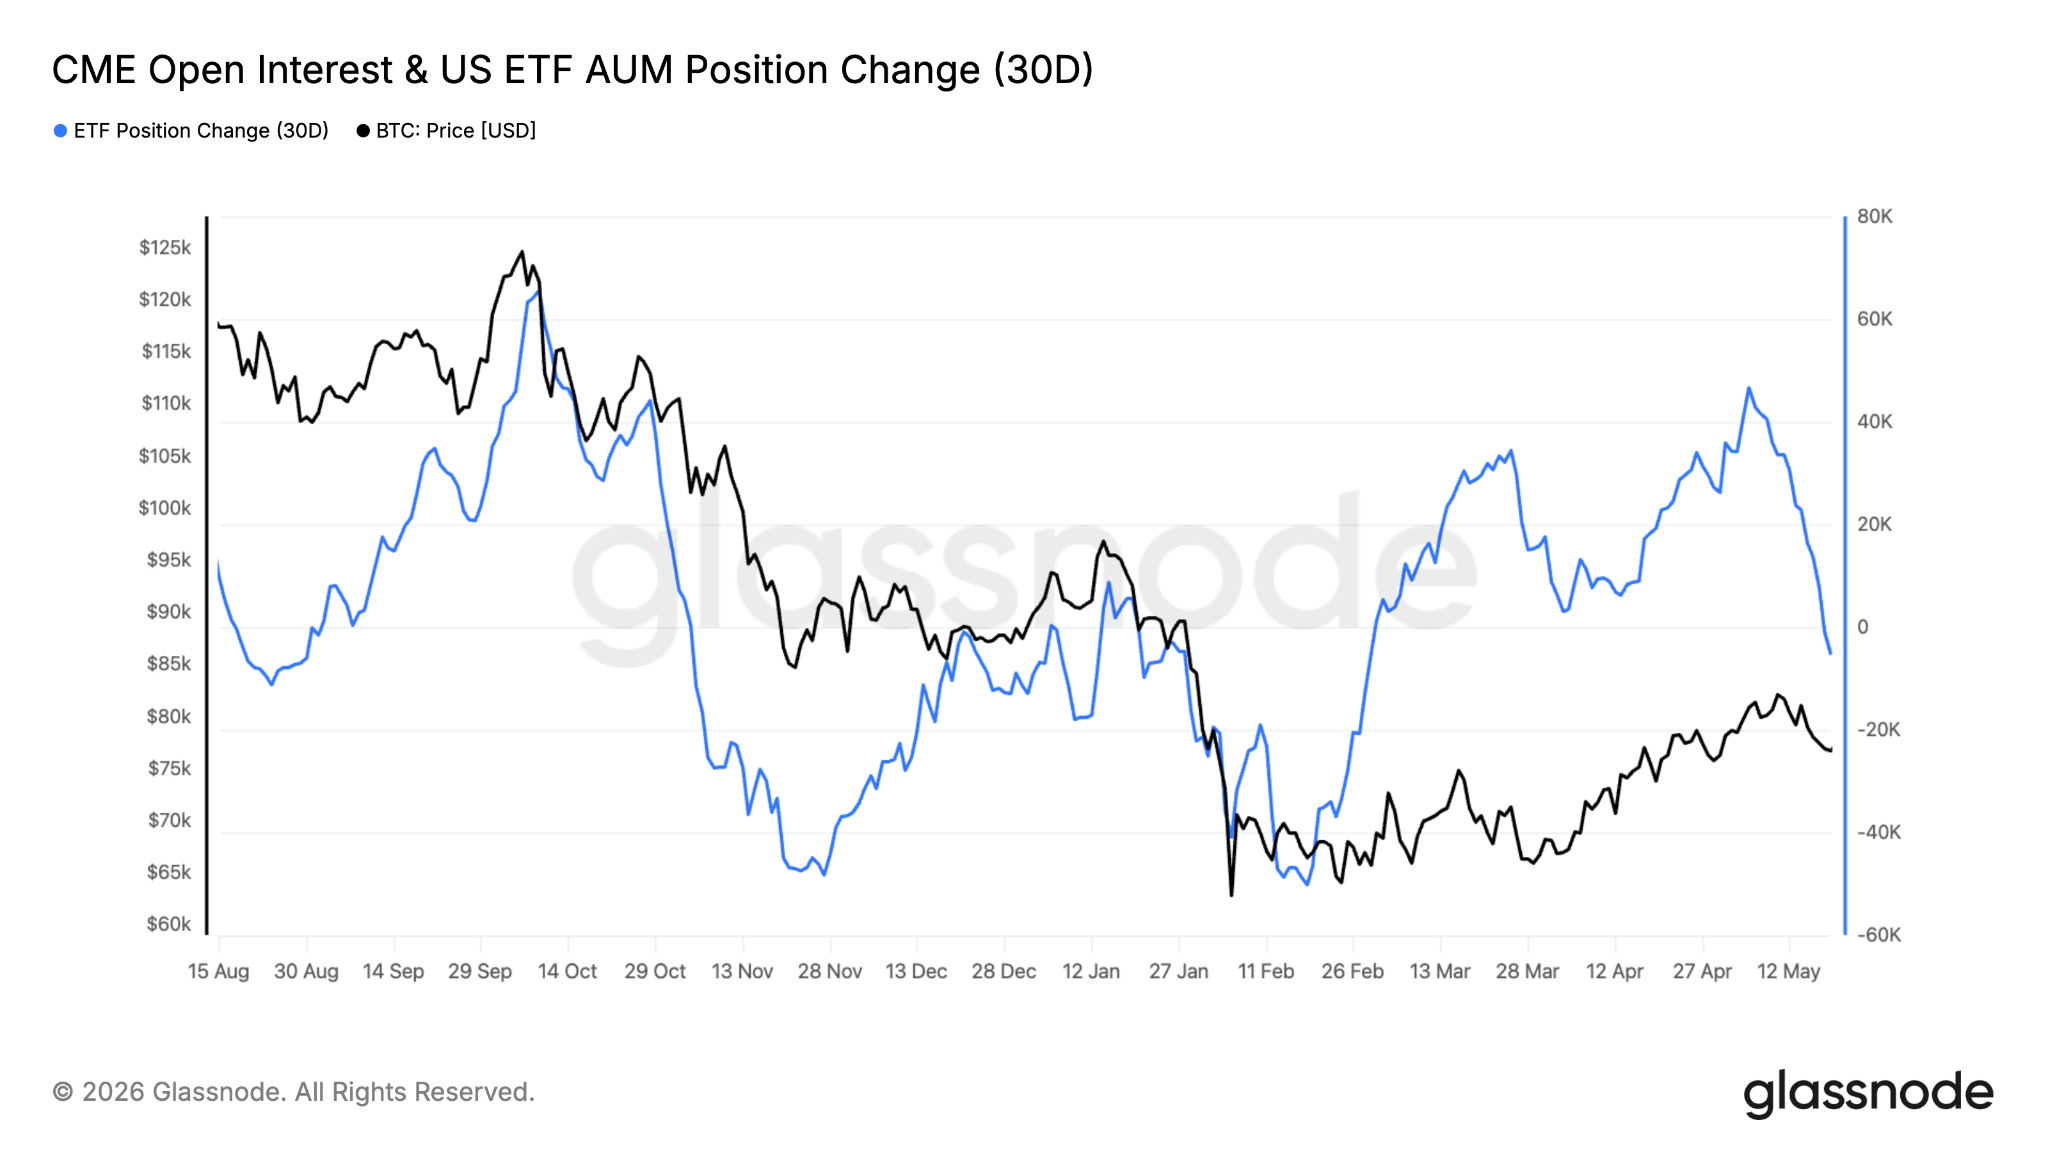
US ETF AUM position change. Source: Glassnode
The simultaneous deterioration across spot demand and ETF flows has “historically been more consistent with renewed price weakness than with stable consolidation,” CryptoQuant concluded.
Bitcoin’s price is at an inflection point
Bitcoin’s 38% rally to $82,800 from its $60,000 macro low marked a notable recovery above the true market mean, now sitting at $78,300.
The true market mean is a price model that tracks the average acquisition cost of actively transacted Bitcoin supply and “historically serves as the dividing line between bear and bull market regimes, according to Glassnode.
The onchain data provider said that reclaiming this level is a “necessary but not sufficient condition for a structural transition,” adding:
“Conventionally, pre-bull market phases require weeks to months of sustained consolidation around this model before a credible regime shift can be confirmed.”
Note that the price consolidated around the true market mean for over six months, between March and October 2021, before breaking into a 174% rally to its previous all-time high of $74,00 reached in March 2024.
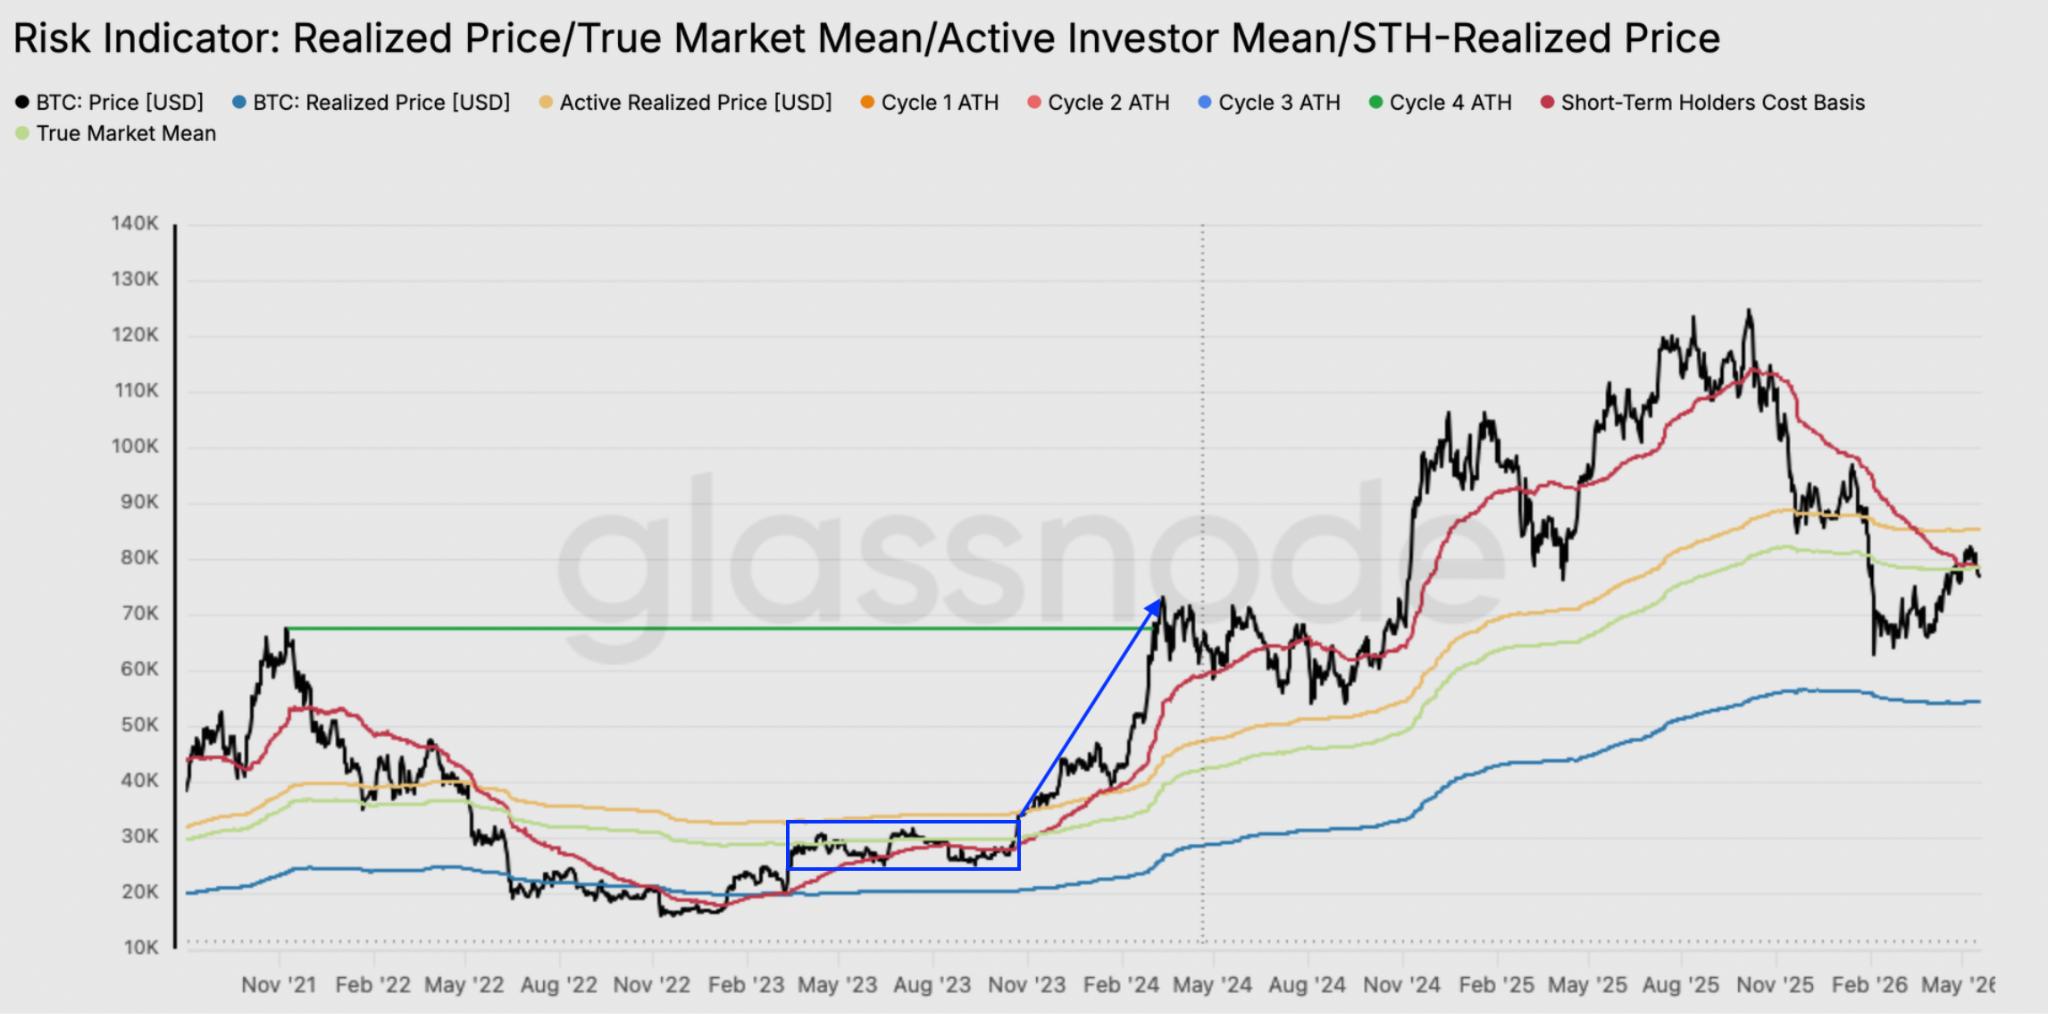
Bitcoin risk indicator. Source: Glassnode
Glassnode added:
“Any deeper correction from current levels would therefore reframe the recent rally as a local top within the ongoing bear market, a structure that has recurred multiple times in prior cycles and remains the higher probability outcome until price demonstrates sustained follow-through.”
Other analysts have highlighted weaknesses in Bitcoin’s market, including fading momentum, declining retail investor activity, aggressive selling in the futures markets and a weakening technical structure, putting BTC at risk of dropping to as low as $65,000 over the next few weeks.